Or


DISCUSS (1 of 2):
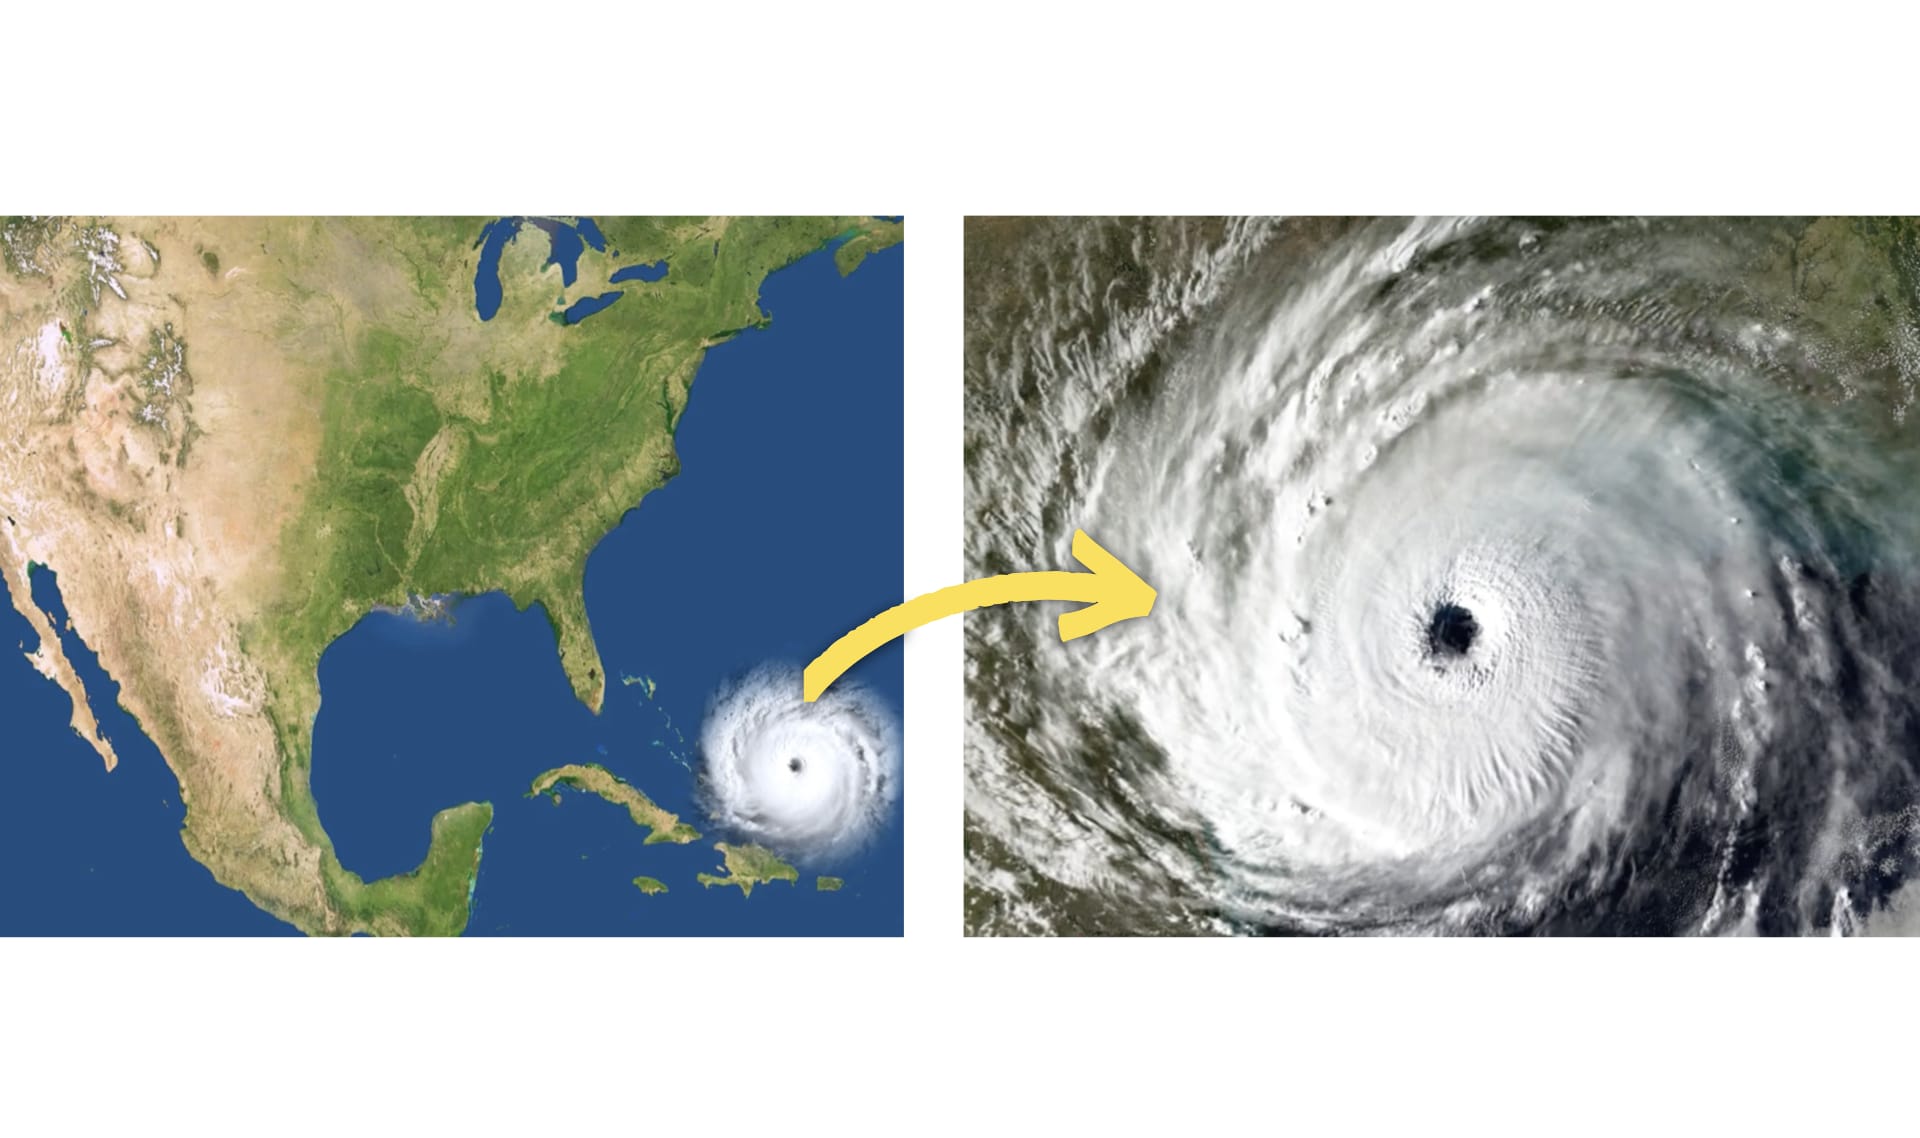
Where does the water in a hurricane come from?
DISCUSS (2 of 2):
Why is there so much rain from a hurricane?
DISCUSS:
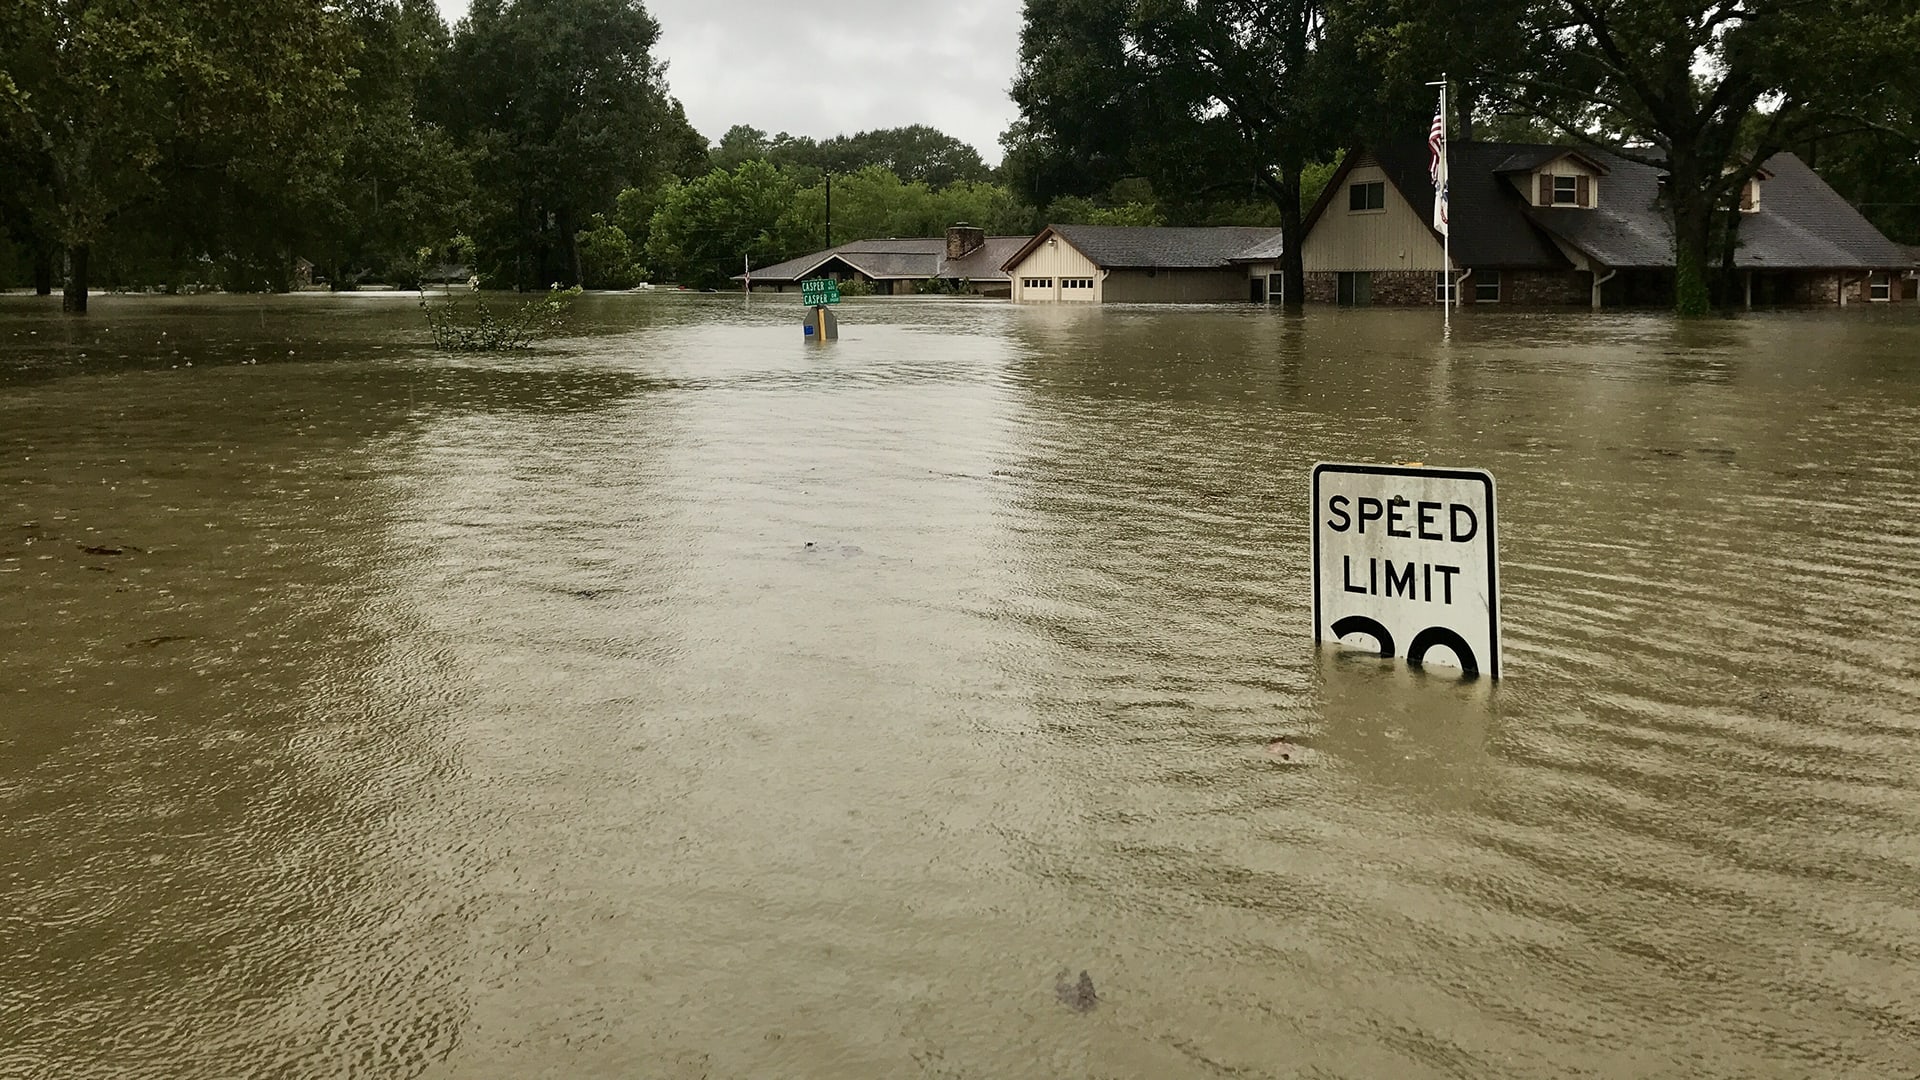
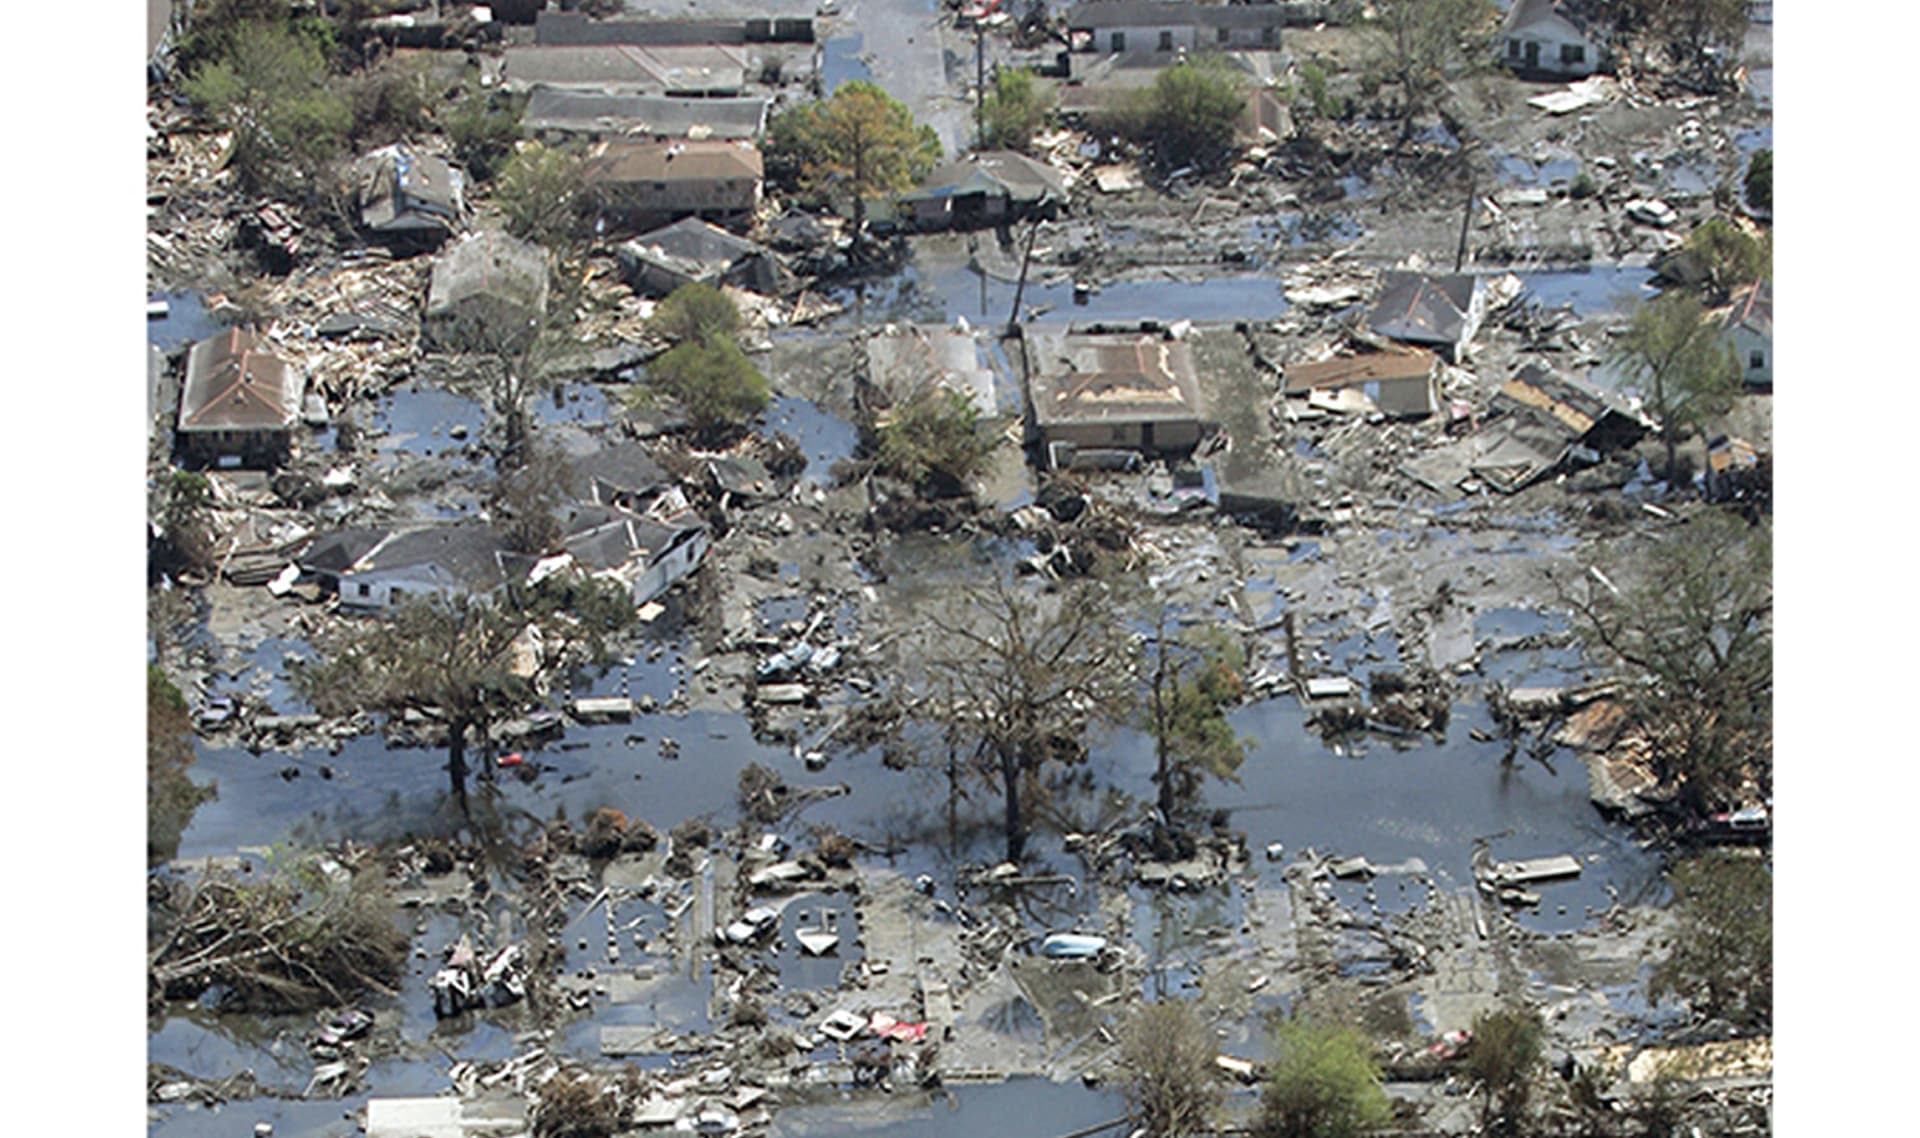
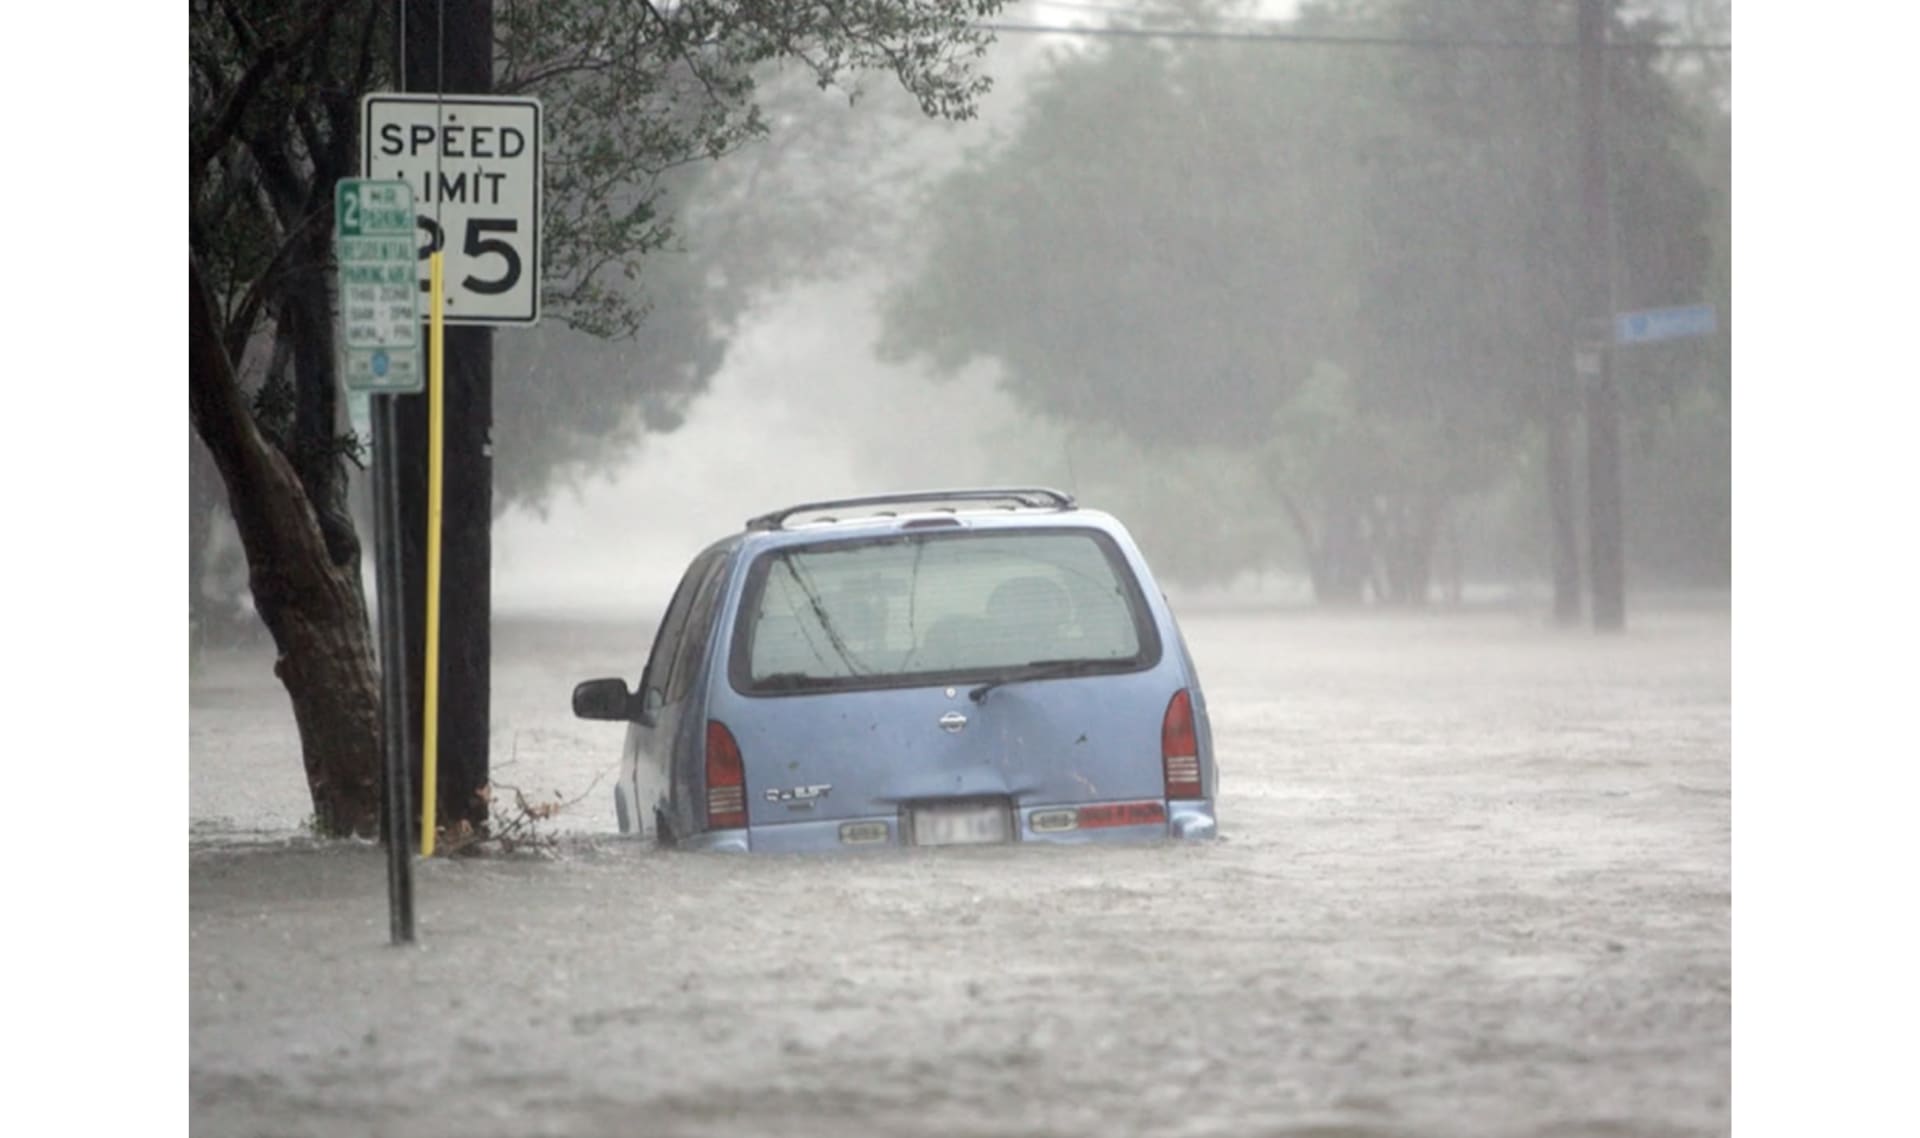
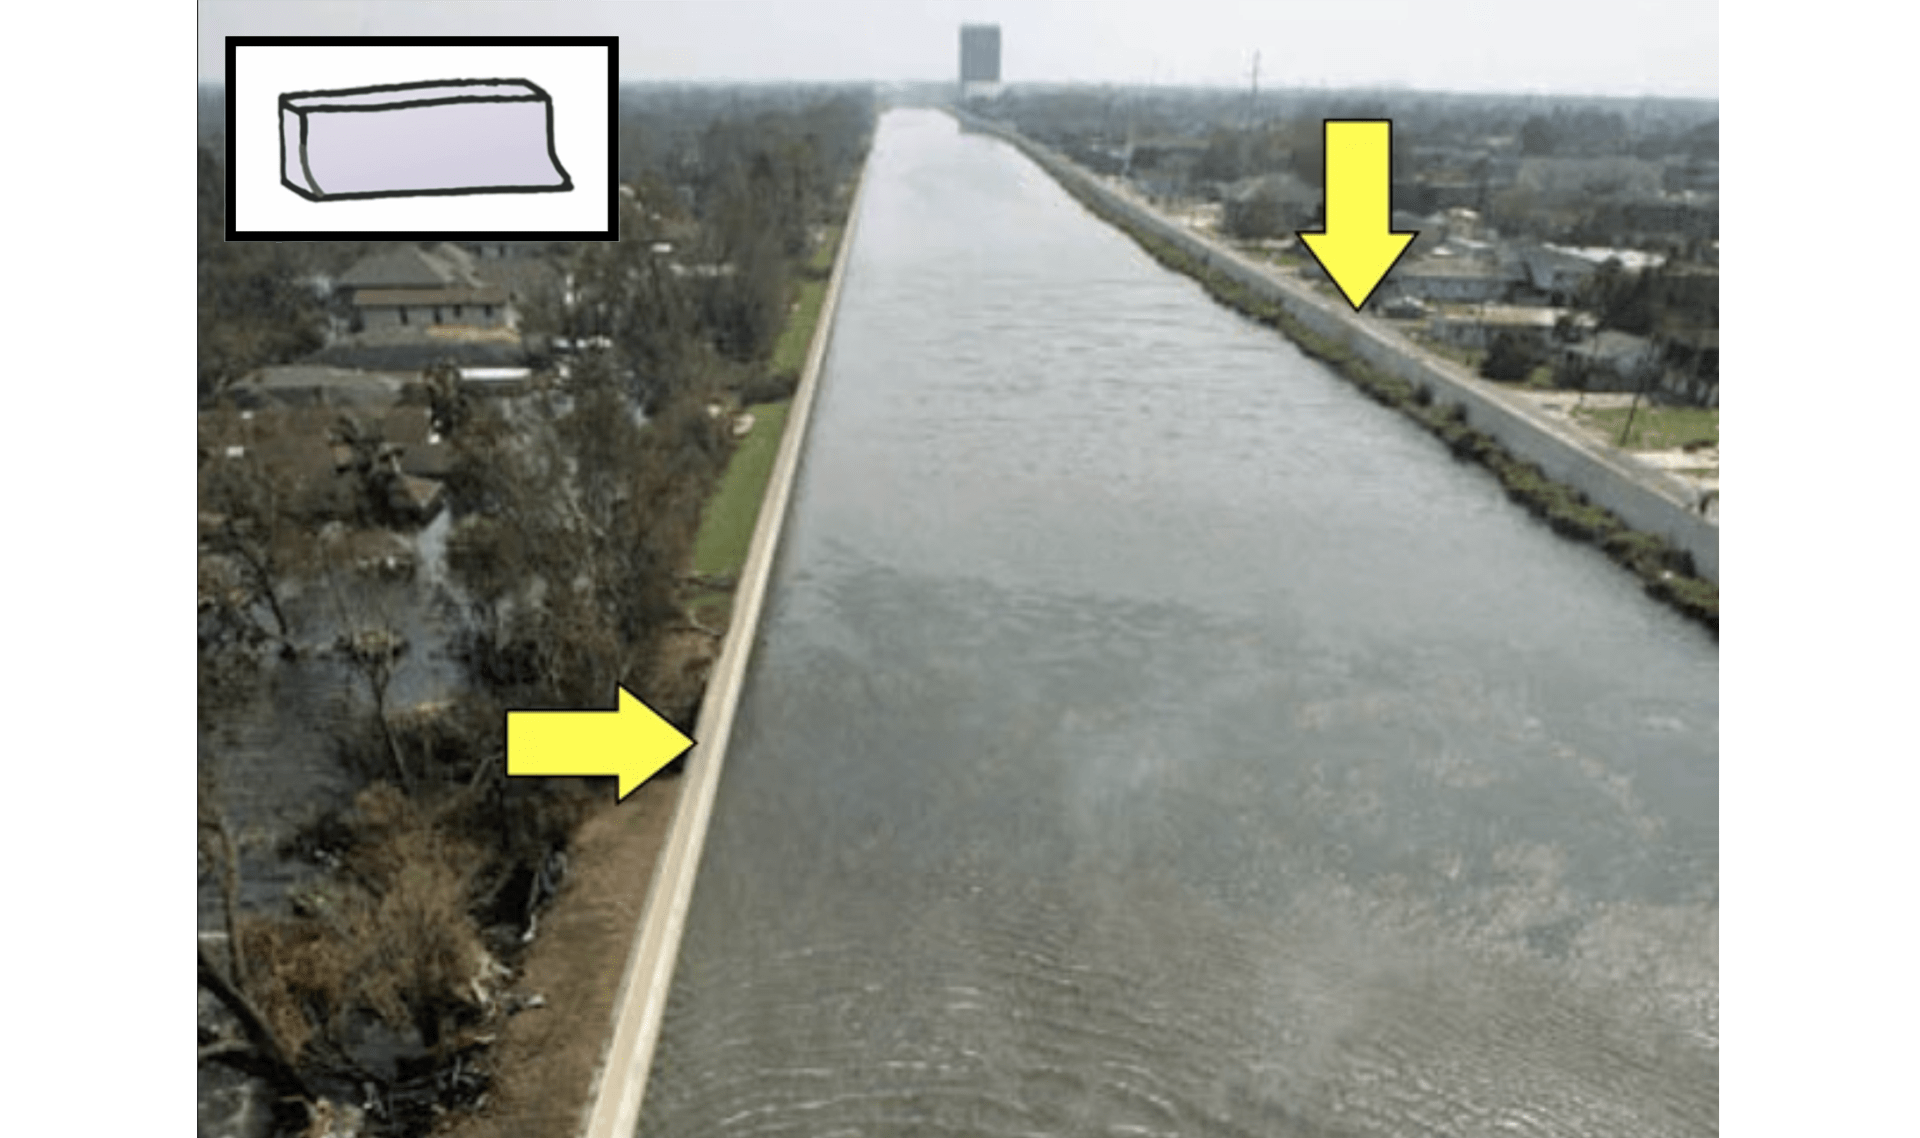
Why do you think some areas of New Orleans flooded while others did not?
Tell your students that the people of Beachtown had a meeting to discuss the proposals your class came up with. Ask your students how they would answer their questions or address their issues.
Remember: There are no right answers and it may be difficult to make everyone happy.
Exciting stories about hurricanes extend students’ knowledge of these powerful storms. The readings from Newsela are free with registration.
Hurricane Florence demonstrated the destructive power of wind and rain. (Newsela, Grade 5)
Fuel for the Storm reveals how hurricanes get their strength. (Ocean Today, a site created by the National Oceanic and Atmospheric Administration)
This time-lapse movie shows a satellite view of the 2012 hurricane season — from June 1 to November 29 — in less than 5 minutes. The excitement starts with hurricane Chris at 0:22, followed by Debbie at 0:30, Ernesto at 1:27, and more.
As you watch, try to answer these questions:
You’ll find more satellite views of hurricanes here.


Grade 5
Water Cycle & Earth's Systems
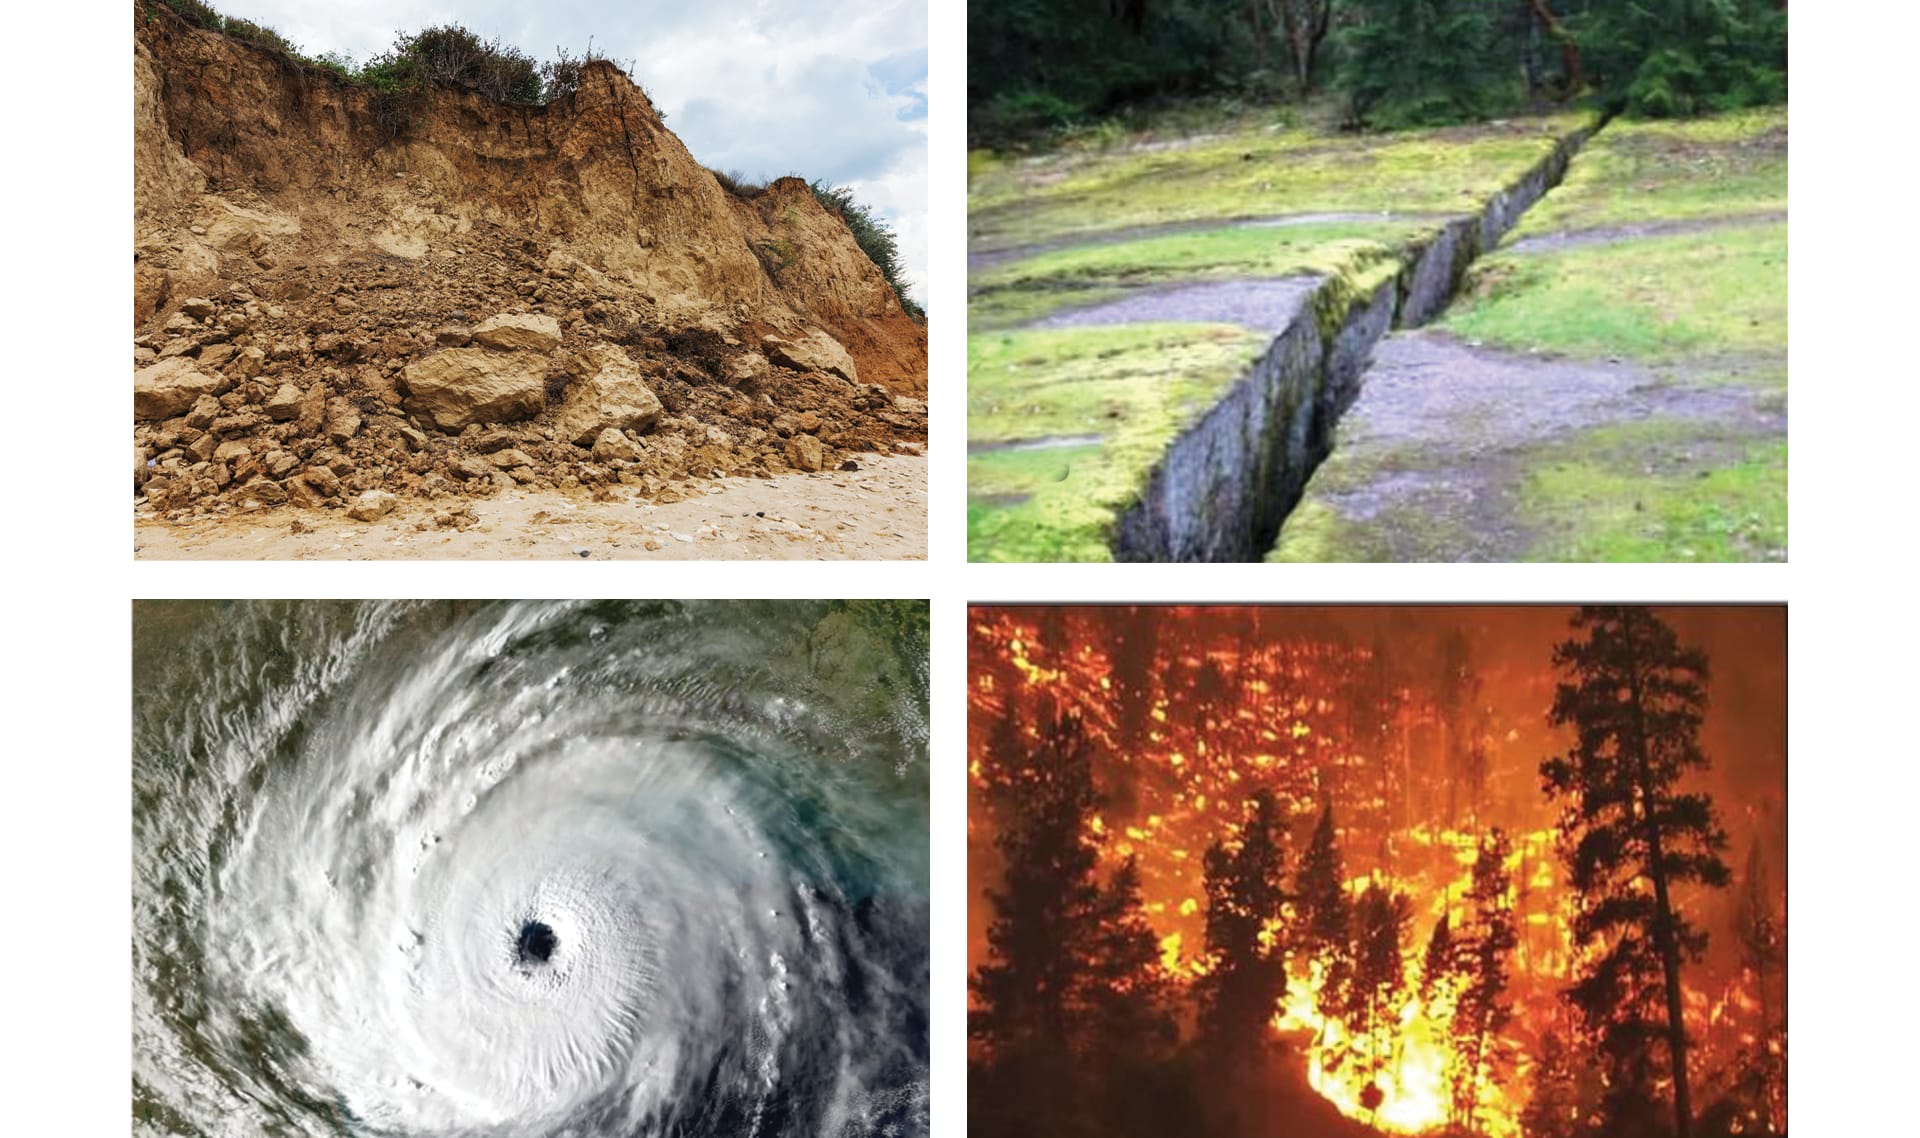
Natural Disasters & Engineering
3-5-ETS1-1, 3-5-ETS1-2, 3-5-ETS1-3
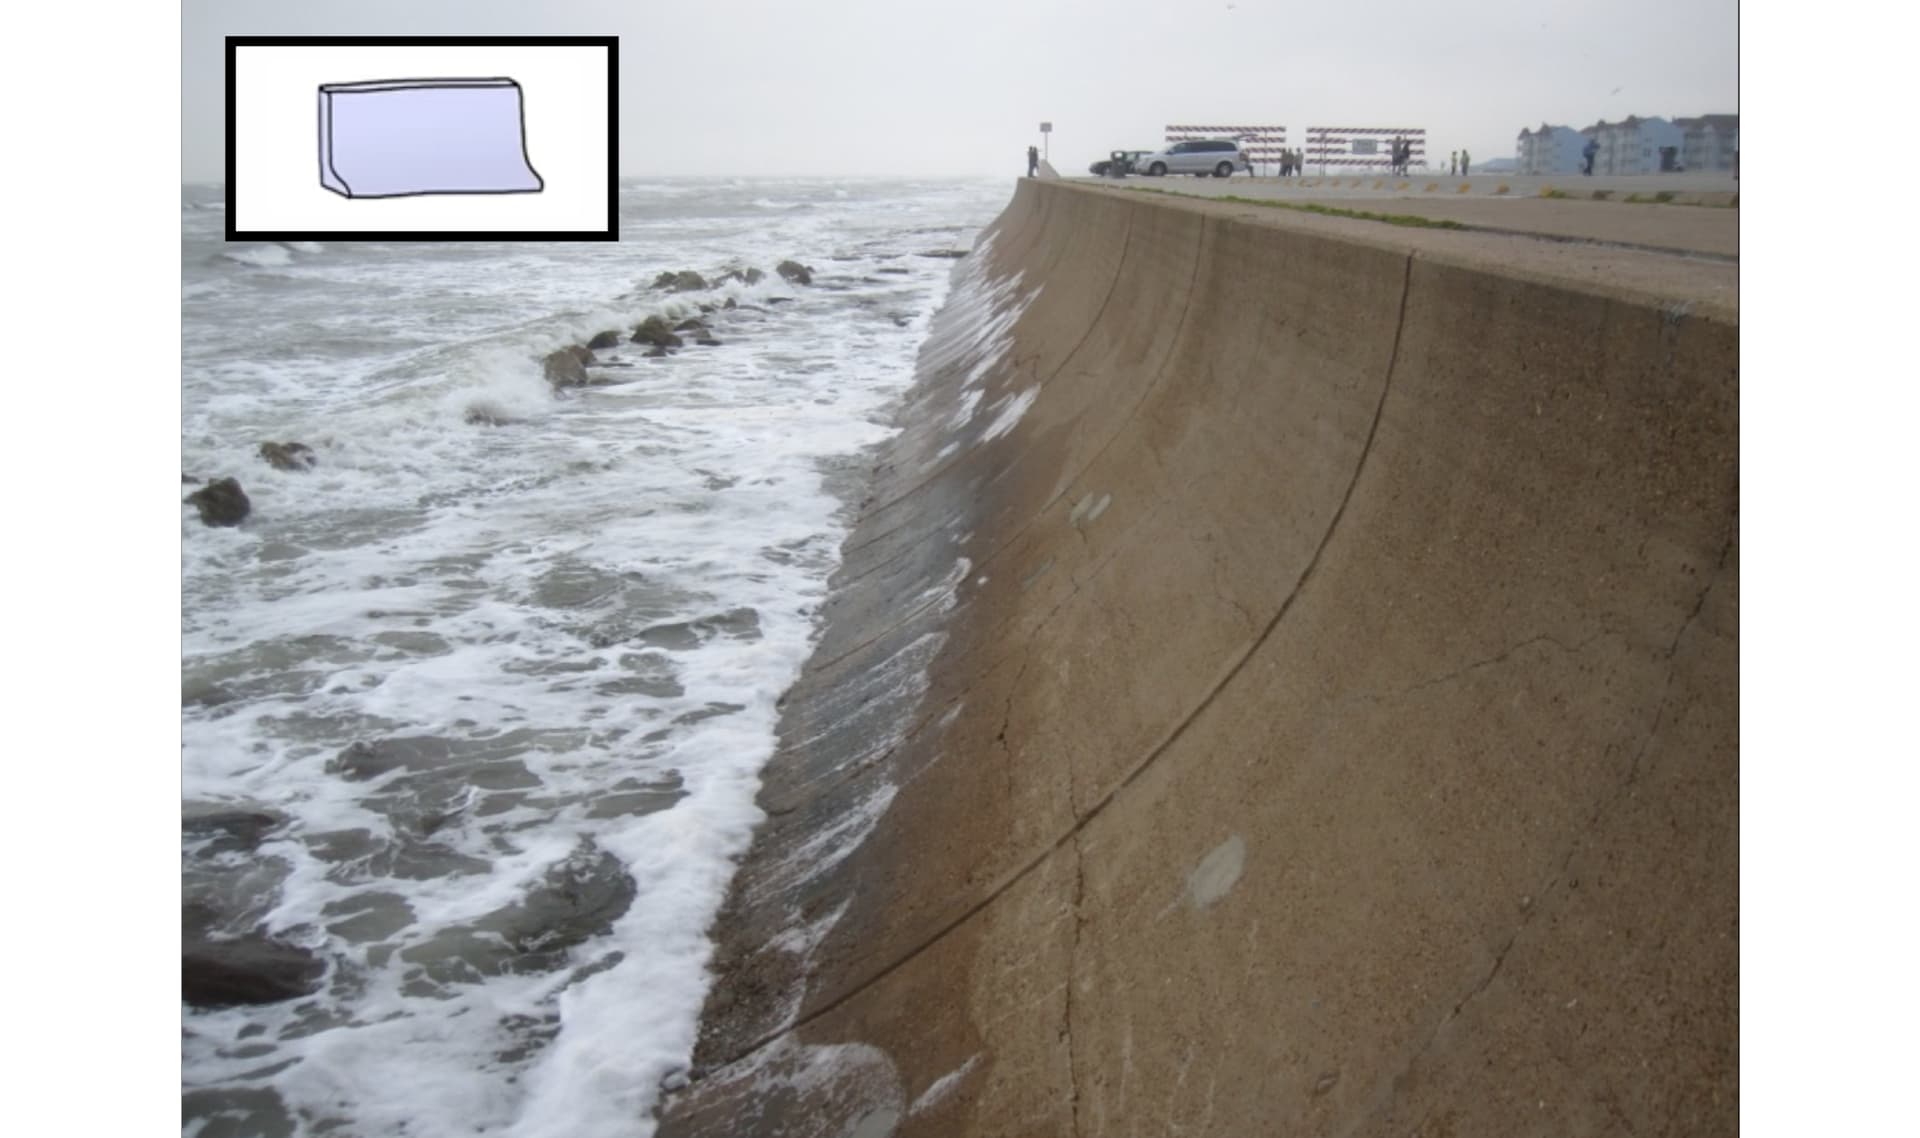
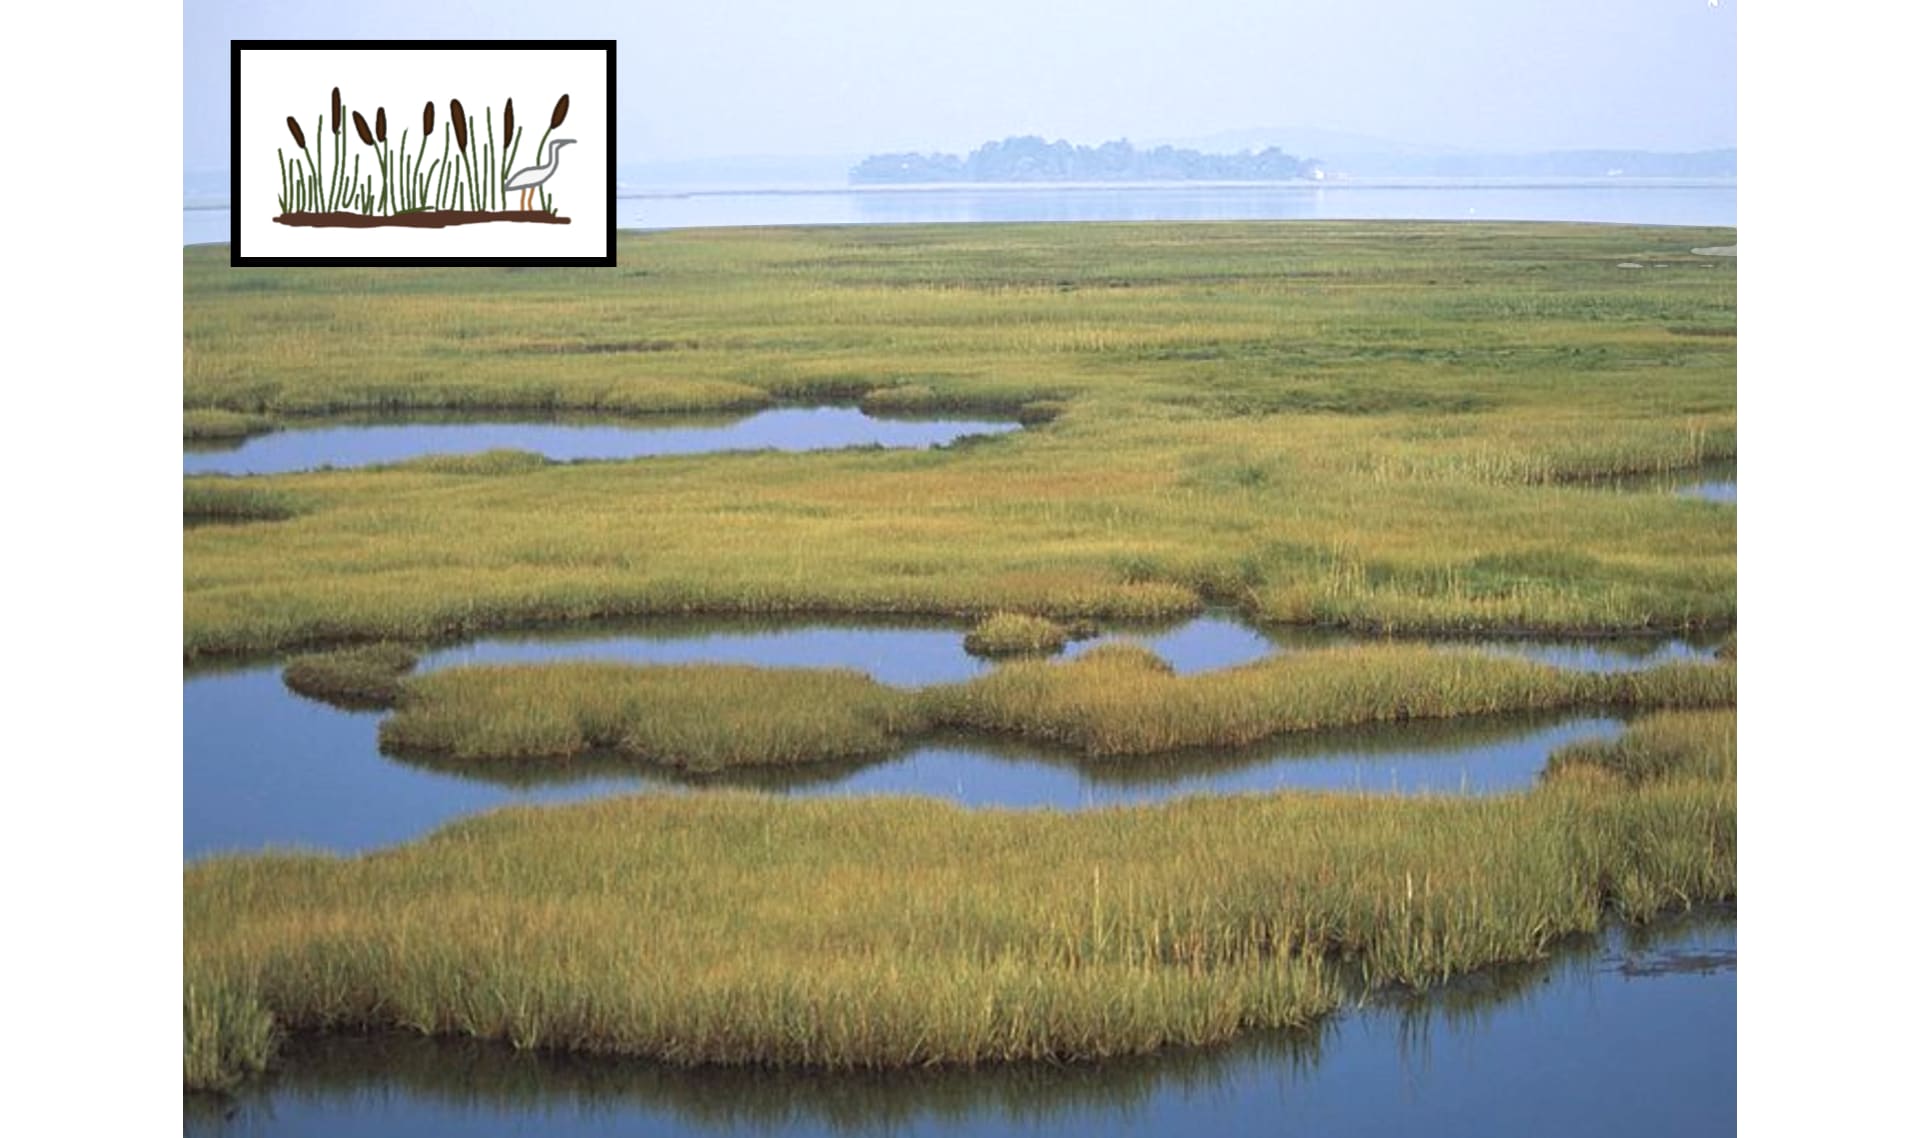
In this lesson, students examine the causes of flooding using the real-world example of Hurricane Katrina. In the activity, Save Beachtown, students propose plans to prevent flooding and save historic buildings in a coastal town–all while staying within budget!
Preview activity| Beachtown Budget worksheet | 30 copies |
| Beachtown Engineers printout | Print 8 copies |
| Beachtown Final Plan worksheet | 8 copies |
|
Colored Pencils
Each student needs one red and one blue. If you don’t have enough, you can substitute similar colors.
Crayons or Markers will also work.
|
Details
60 pencils
|
|
Scissors
|
30 pairs |
|
Glue Dots
|
180 dots |
We suggest students work in groups of four. Homeschool students can do the activity on their own, but we think it’s more fun with a few friends.
This simulation is very engaging and may take more than 20 minutes for students to complete. Consider dividing this lesson into two class periods. We’ve provided challenge questions in the Extensions for those who want to extend the activity.
Each student will need 6-7 glue dots. You may want to prep this prior to class to make distribution easier.
At the start of the activity, students will need the Beachtown Engineers printout, scissors, and colored pencils. They will later need the Beachtown Budget, Final Plan, and some sticky glue dots. You may want to separate these supplies into two piles for easier classroom distribution.
You may want students to post their work so that each group can see the similarities and differences in the engineering solutions. If you decide to do this, you’ll need wall space and supplies (tape or push pins) to display The Final Plan of each group.
Grade 5
Water Cycle & Earth's Systems
Natural Disasters & Engineering
3-5-ETS1-1, 3-5-ETS1-2, 3-5-ETS1-3
Thanks for your feedback! If you have a question or need help, please contact us. Please consider sharing your review:
Sorry the lesson didn’t go well. We read every single review in an effort to improve our Mysteries.
Thanks for letting us know. We’ll wait to ask you for feedback until after you've actually taught it.
Thanks for the feedback! We read every single review in an effort to improve our Mysteries.
Please follow these steps:
Locked
6:10

Why is the sky blue?
Locked
4:41

Why do we call them doughnuts?
Locked
5:16
Could a turtle live outside its shell?
Your membership is expired. The archive of past Mini Lessons is not included in your limited access.
View pricing