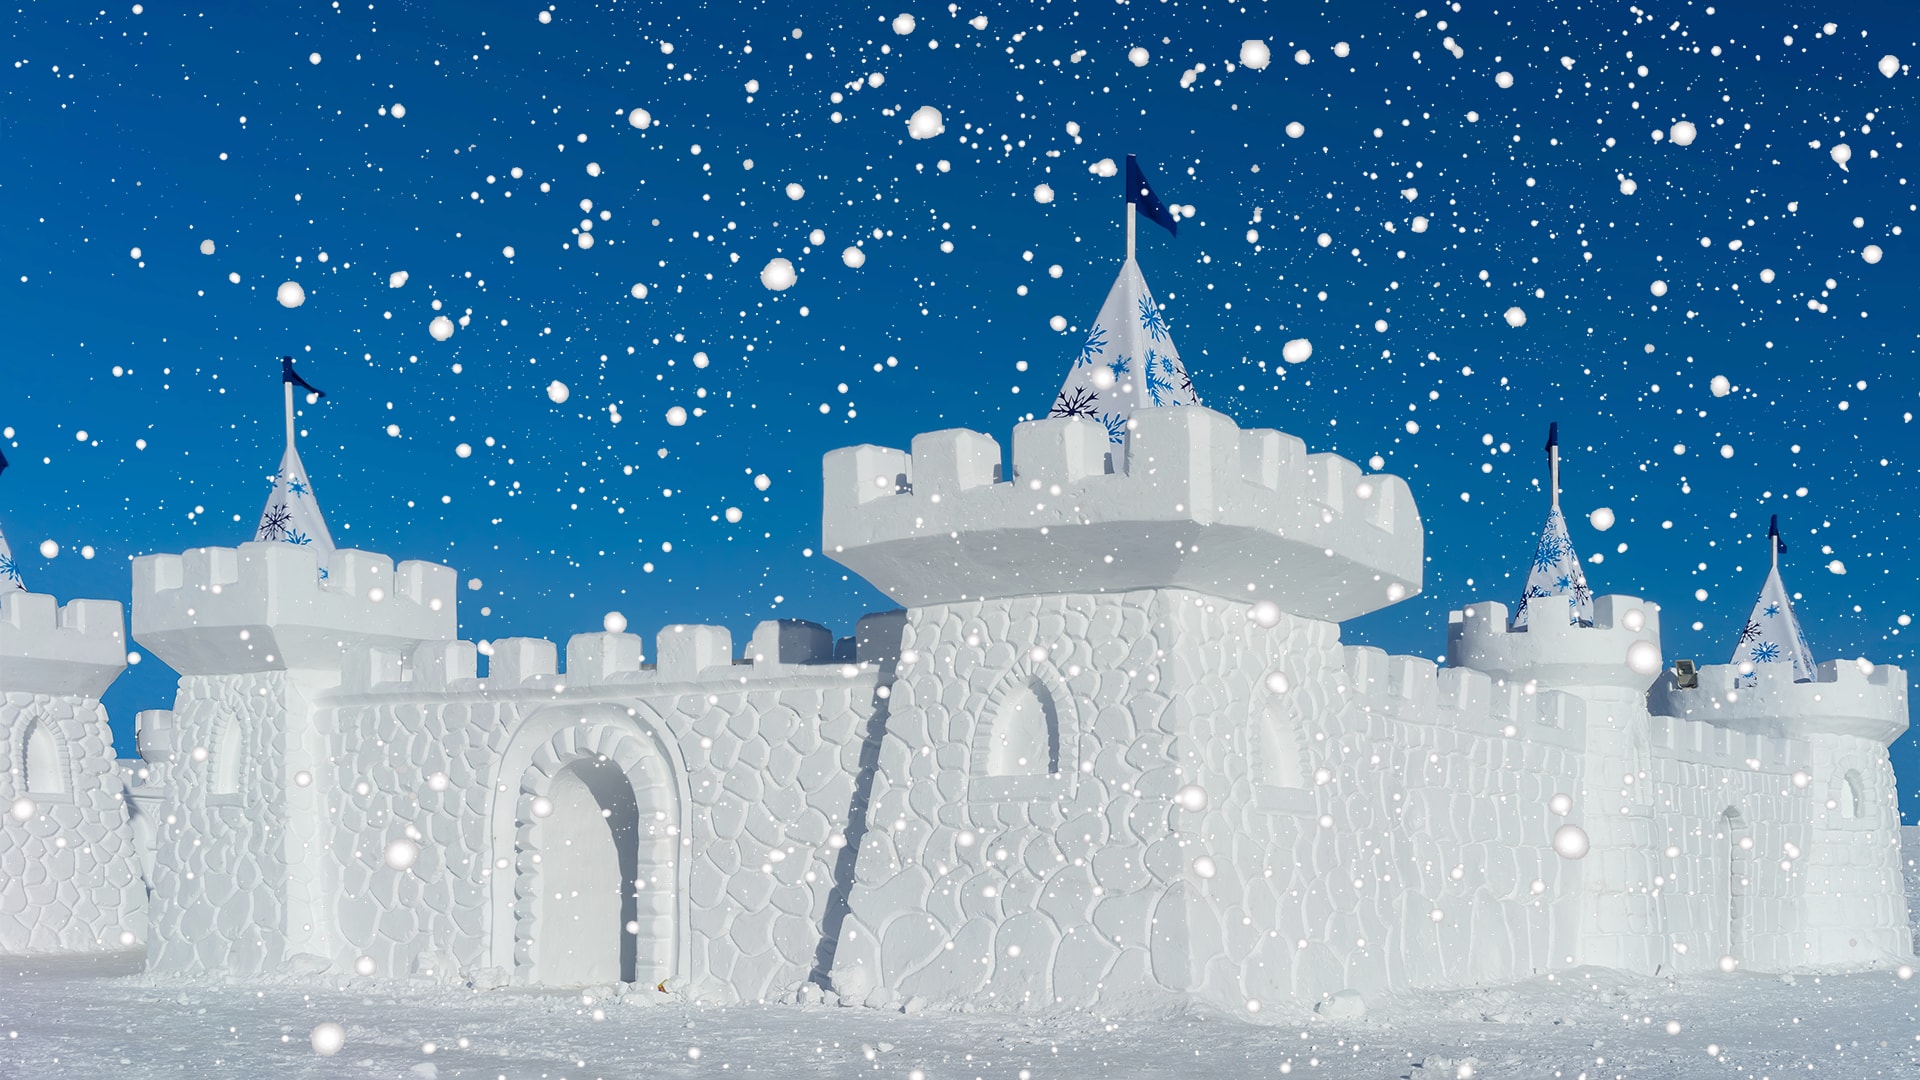
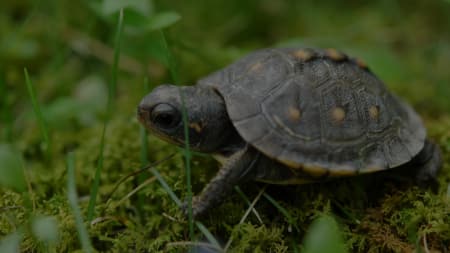
Scroll for prep

Please wait…
This video is having trouble loading. You may have lost your Internet connection.
Step 1: Click to Reload this page
Step 2: Click to
Try our other video player
Step 3: Contact your teacher if trouble persists.
Or,
dismiss this message.
DISCUSS:
How do you know it’s winter where you live?
What changes do you notice?

Please wait…
This video is having trouble loading. You may have lost your Internet connection.
Step 1: Click to Reload this page
Step 2: Click to
Try our other video player
Step 3: Contact your teacher if trouble persists.
Or,
dismiss this message.
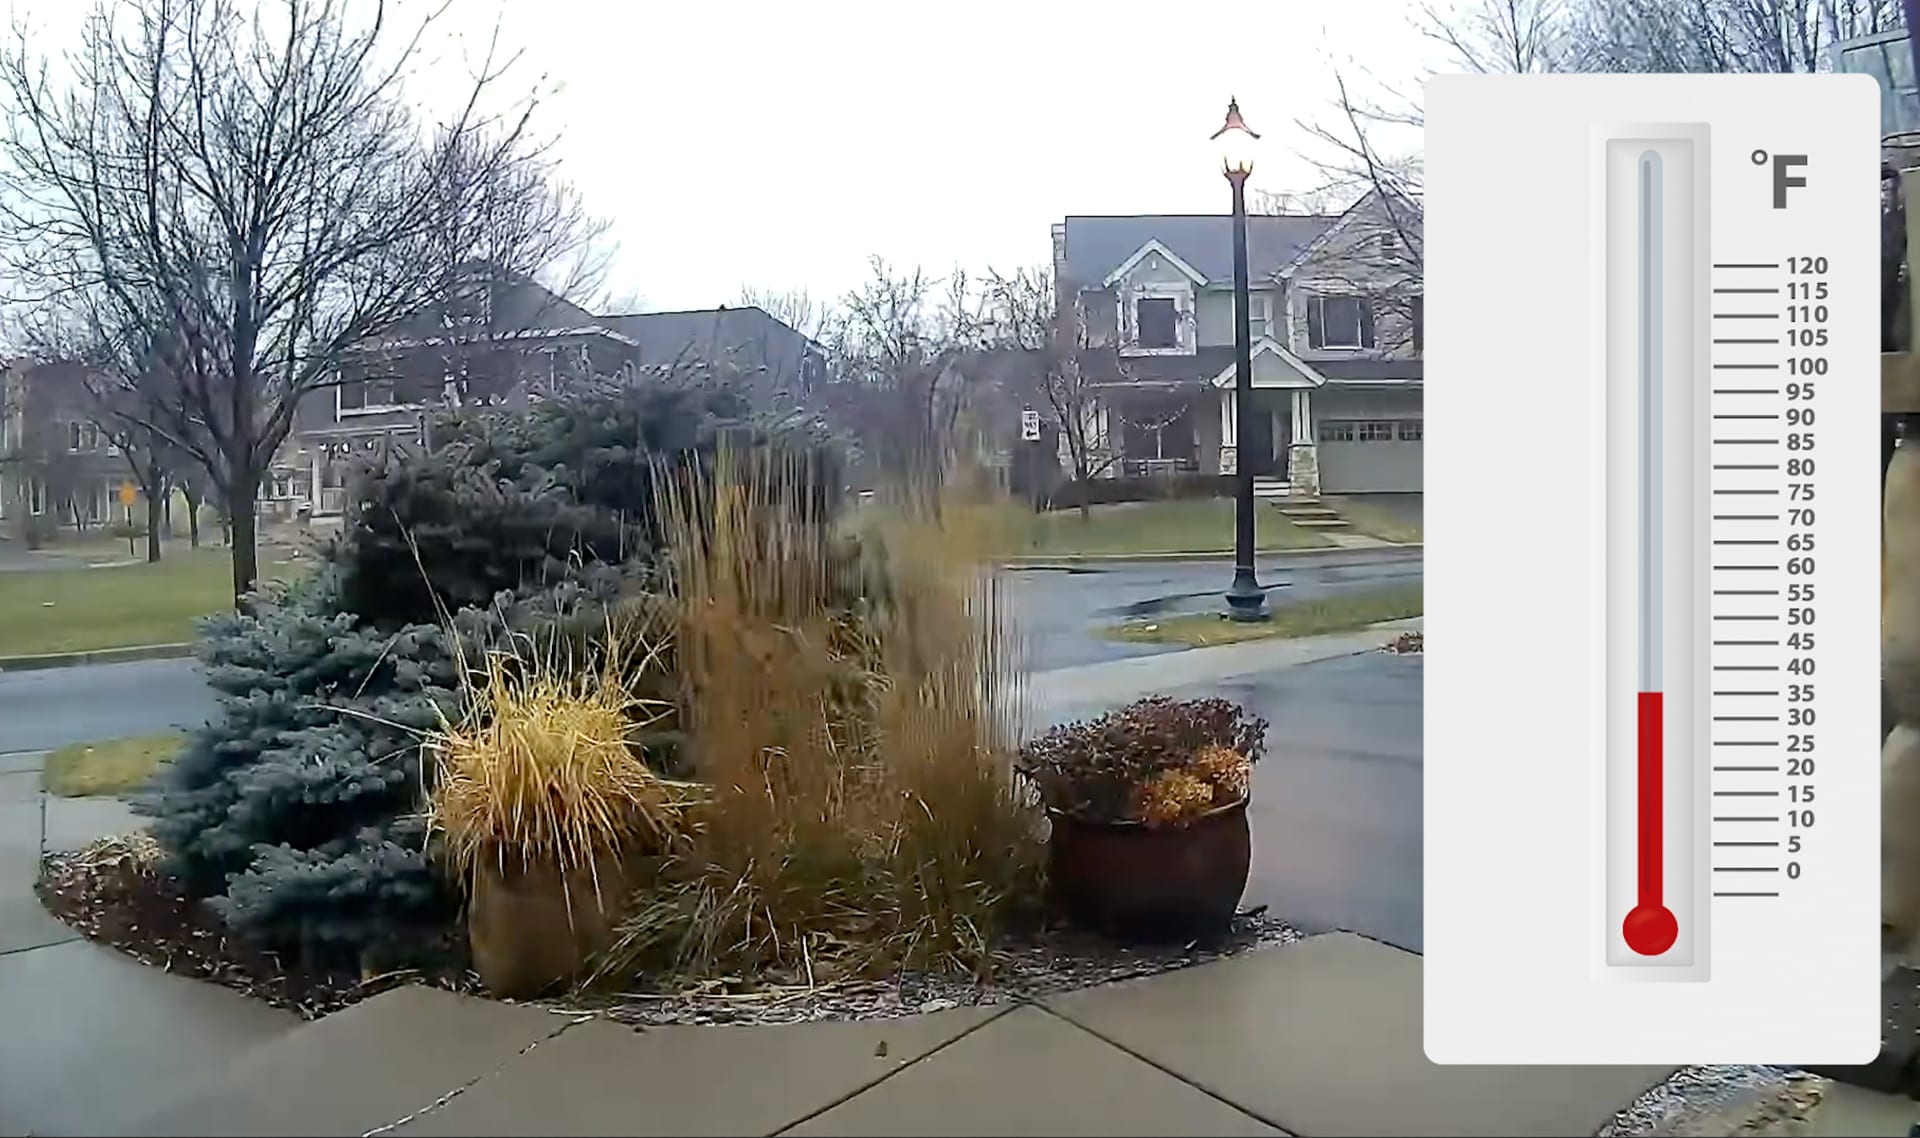
DISCUSS:
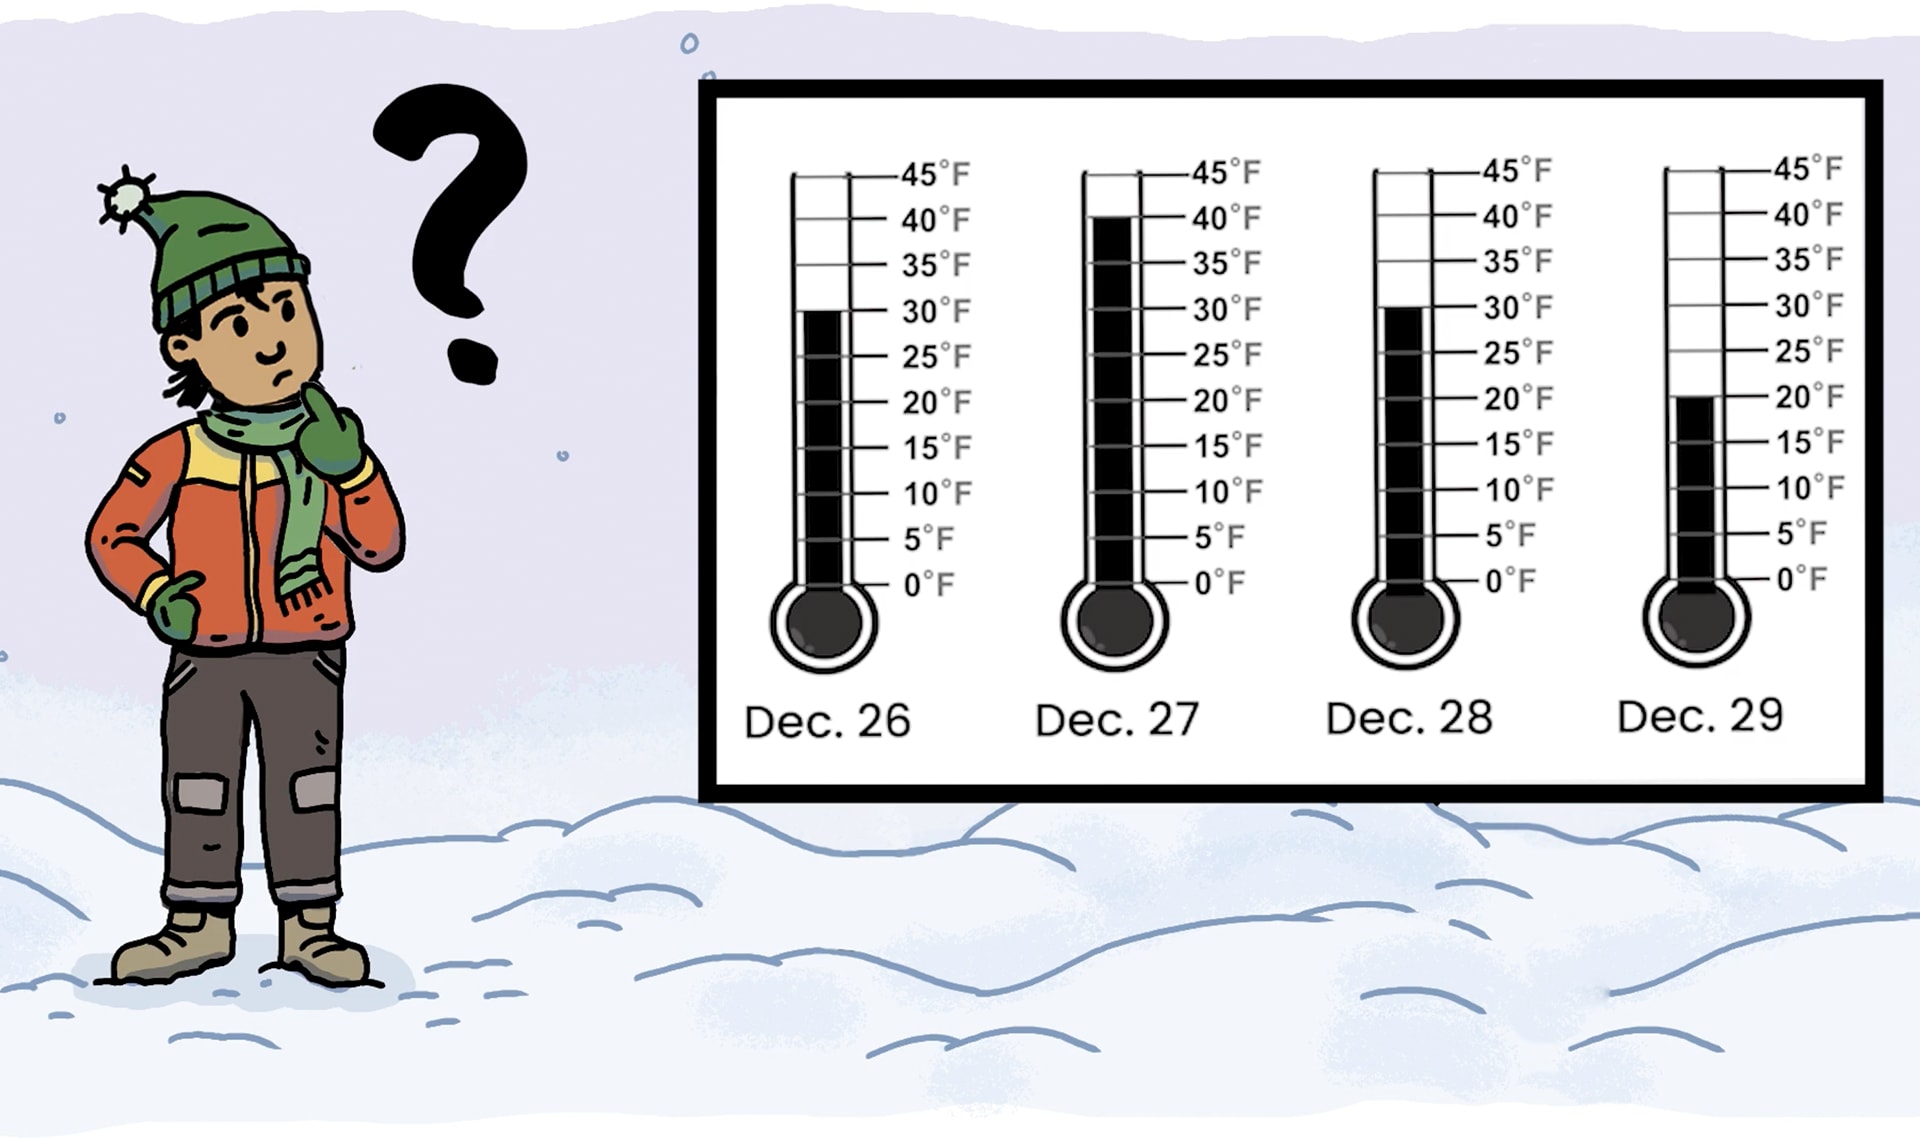
What temperature does the thermometer show here?
Do you see any OTHER clues that tell you if this temperature is hot or cold?
What temperature does the thermometer show here?
Do you see any OTHER clues that tell you if this temperature is hot or cold?

Please wait…
This video is having trouble loading. You may have lost your Internet connection.
Step 1: Click to Reload this page
Step 2: Click to
Try our other video player
Step 3: Contact your teacher if trouble persists.
Or,
dismiss this message.
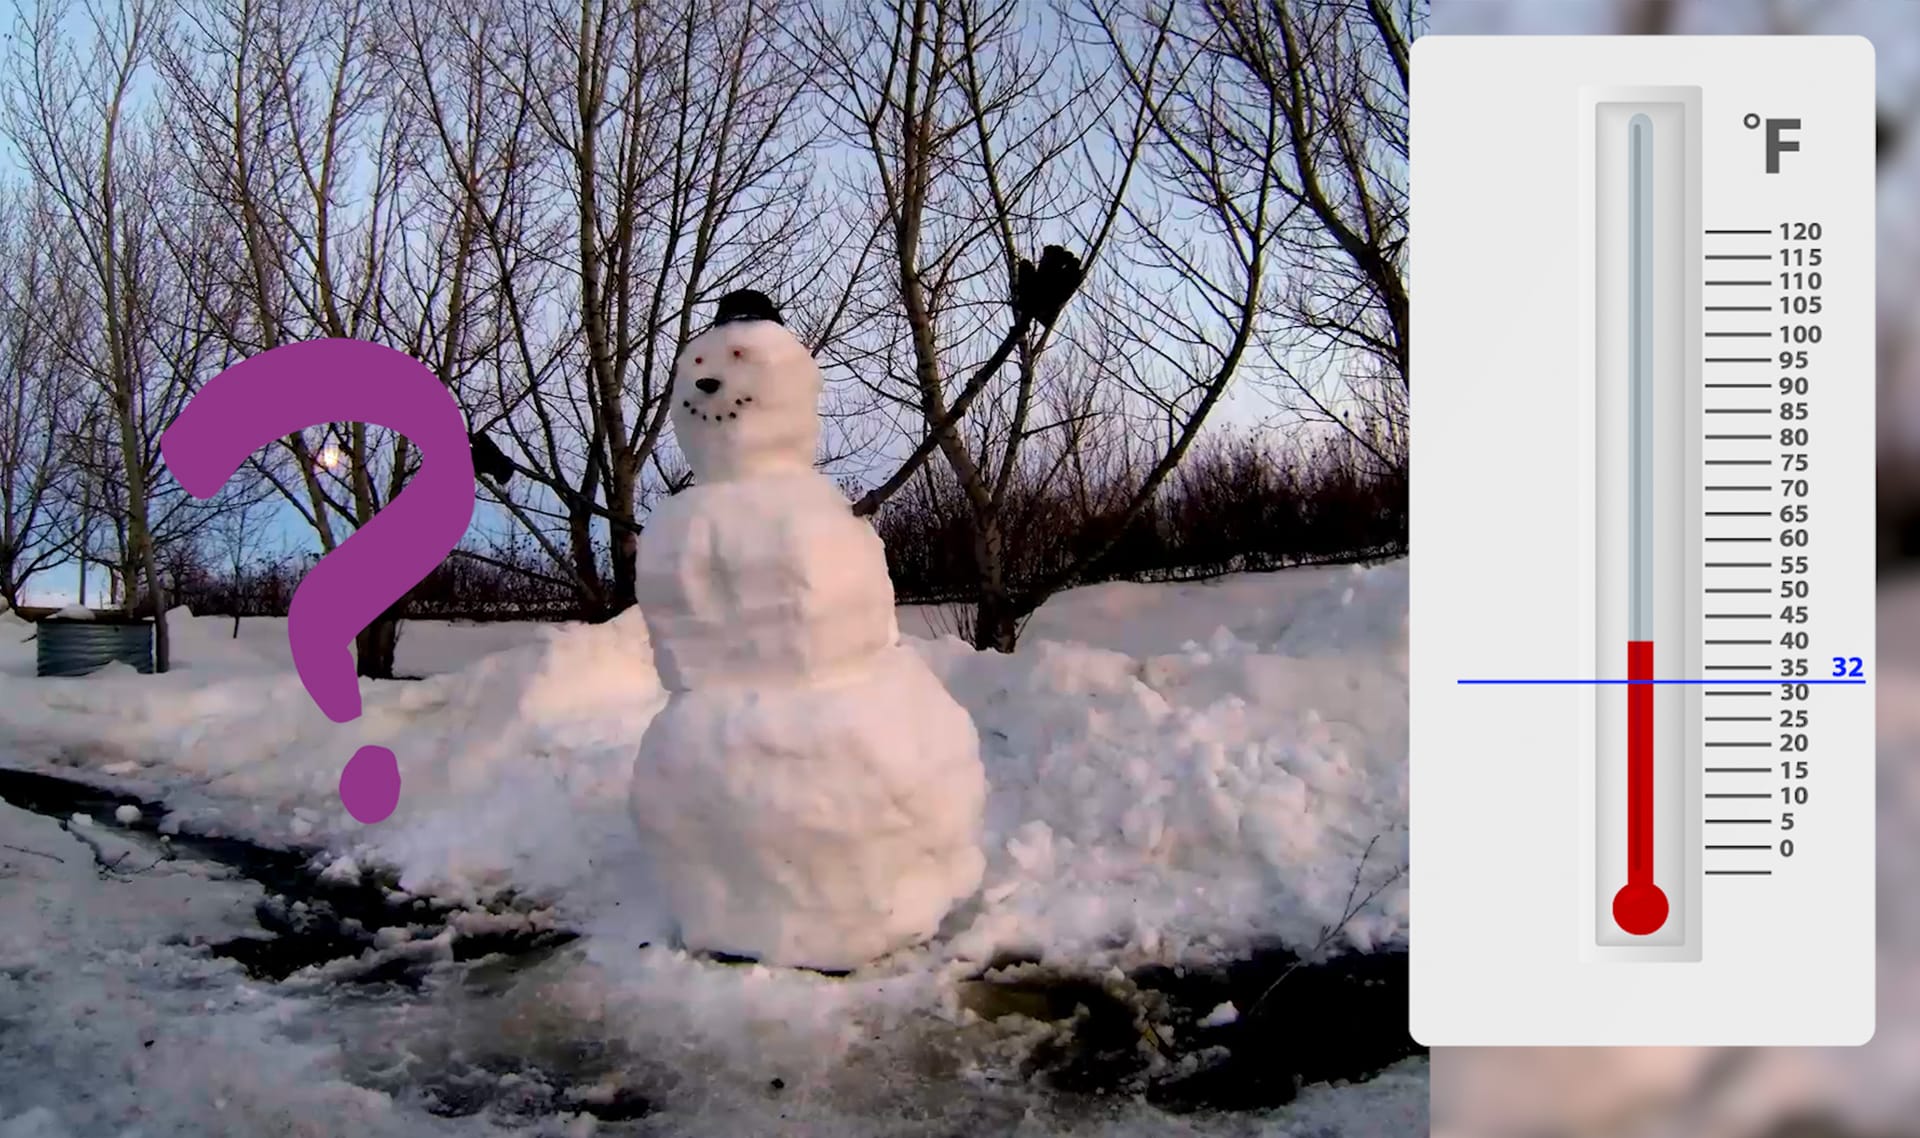
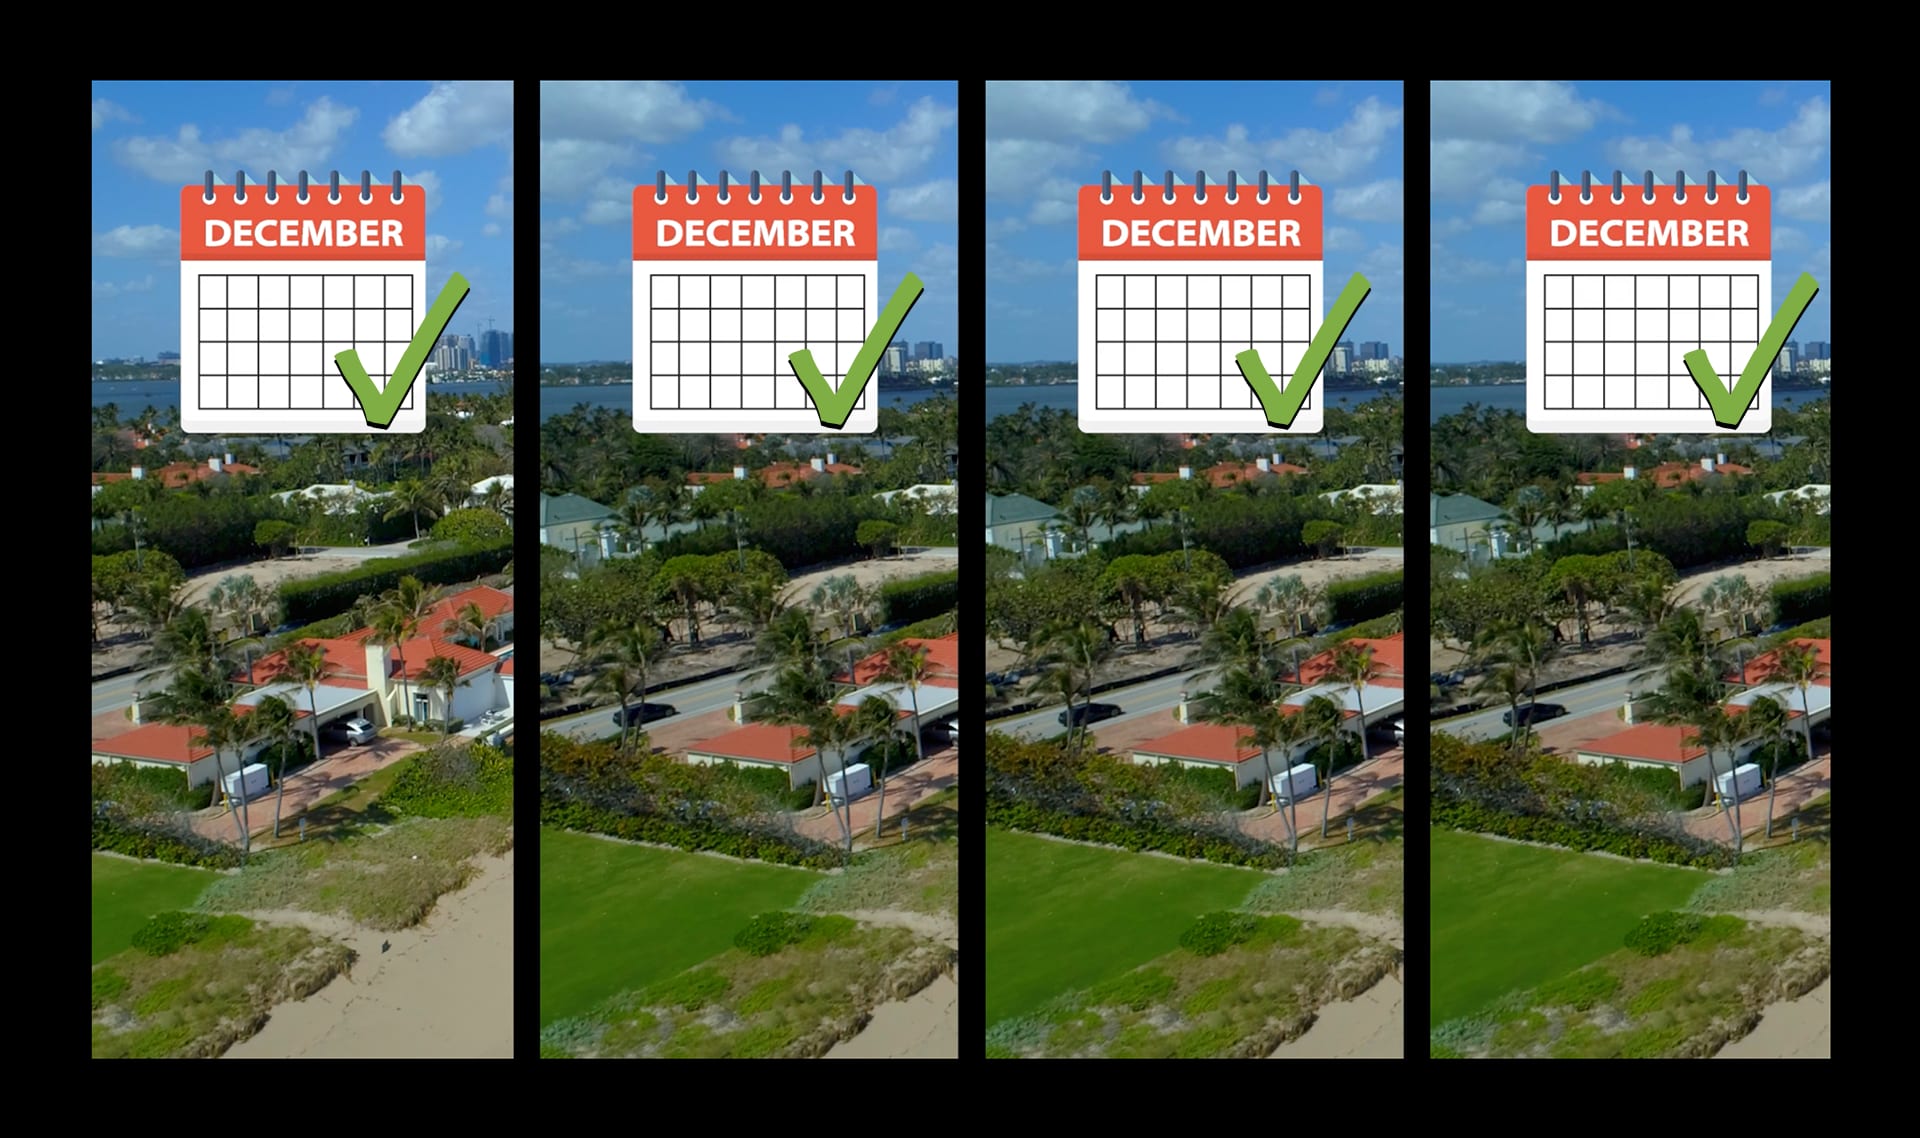
DISCUSS: How do you think this place will change if the temperature stays ABOVE 32 degrees Fahrenheit for a long time? What will look different here?

Please wait…
This video is having trouble loading. You may have lost your Internet connection.
Step 1: Click to Reload this page
Step 2: Click to
Try our other video player
Step 3: Contact your teacher if trouble persists.
Or,
dismiss this message.
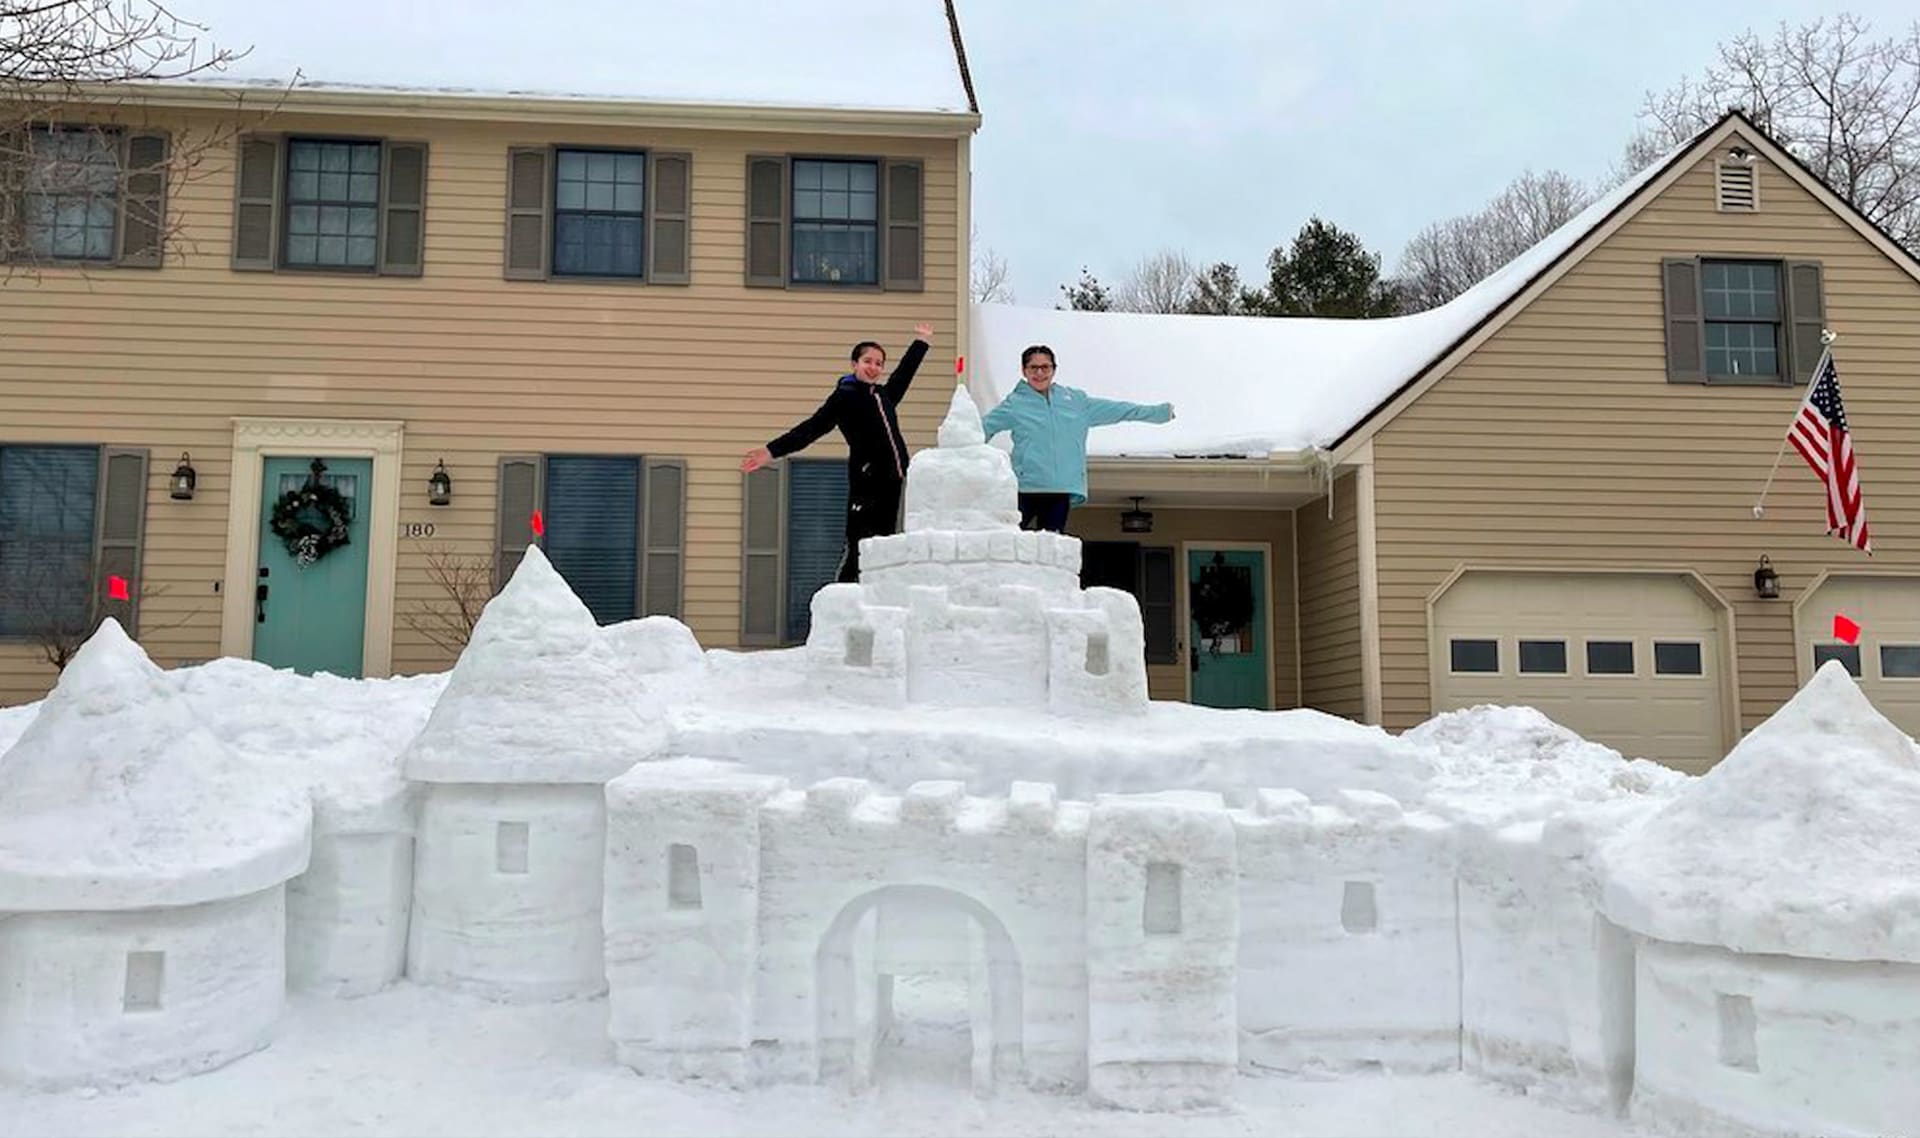
DISCUSS:
Will the weather be good for building a snow fort where you live next winter?
How do you know?
Will the weather be good for building a snow fort where you live next winter?
How do you know?

Please wait…
This video is having trouble loading. You may have lost your Internet connection.
Step 1: Click to Reload this page
Step 2: Click to
Try our other video player
Step 3: Contact your teacher if trouble persists.
Or,
dismiss this message.
DISCUSS:
Suppose you wanted to find a great spot to build a snow fort next December.
What kinds of data could you collect to find a place with great weather for snow fort building?

Please wait…
This video is having trouble loading. You may have lost your Internet connection.
Step 1: Click to Reload this page
Step 2: Click to
Try our other video player
Step 3: Contact your teacher if trouble persists.
Or,
dismiss this message.

Please wait…
This video is having trouble loading. You may have lost your Internet connection.
Step 1: Click to Reload this page
Step 2: Click to
Try our other video player
Step 3: Contact your teacher if trouble persists.
Or,
dismiss this message.
Step
01/18
01/18
For this activity, you’ll work with a partner. Once you have a partner,
decide who will be Snowball and who will be Icicle.
decide who will be Snowball and who will be Icicle.

Please wait…
This video is having trouble loading. You may have lost your Internet connection.
Step 1: Click to Reload this page
Step 2: Click to
Try our other video player
Step 3: Contact your teacher if trouble persists.
Or,
dismiss this message.
Step
02/18
02/18
You’re going to hear about the three different towns that want to
have the festival. But first, get your supplies.
have the festival. But first, get your supplies.

Please wait…
This video is having trouble loading. You may have lost your Internet connection.
Step 1: Click to Reload this page
Step 2: Click to
Try our other video player
Step 3: Contact your teacher if trouble persists.
Or,
dismiss this message.
Step
03/18
03/18
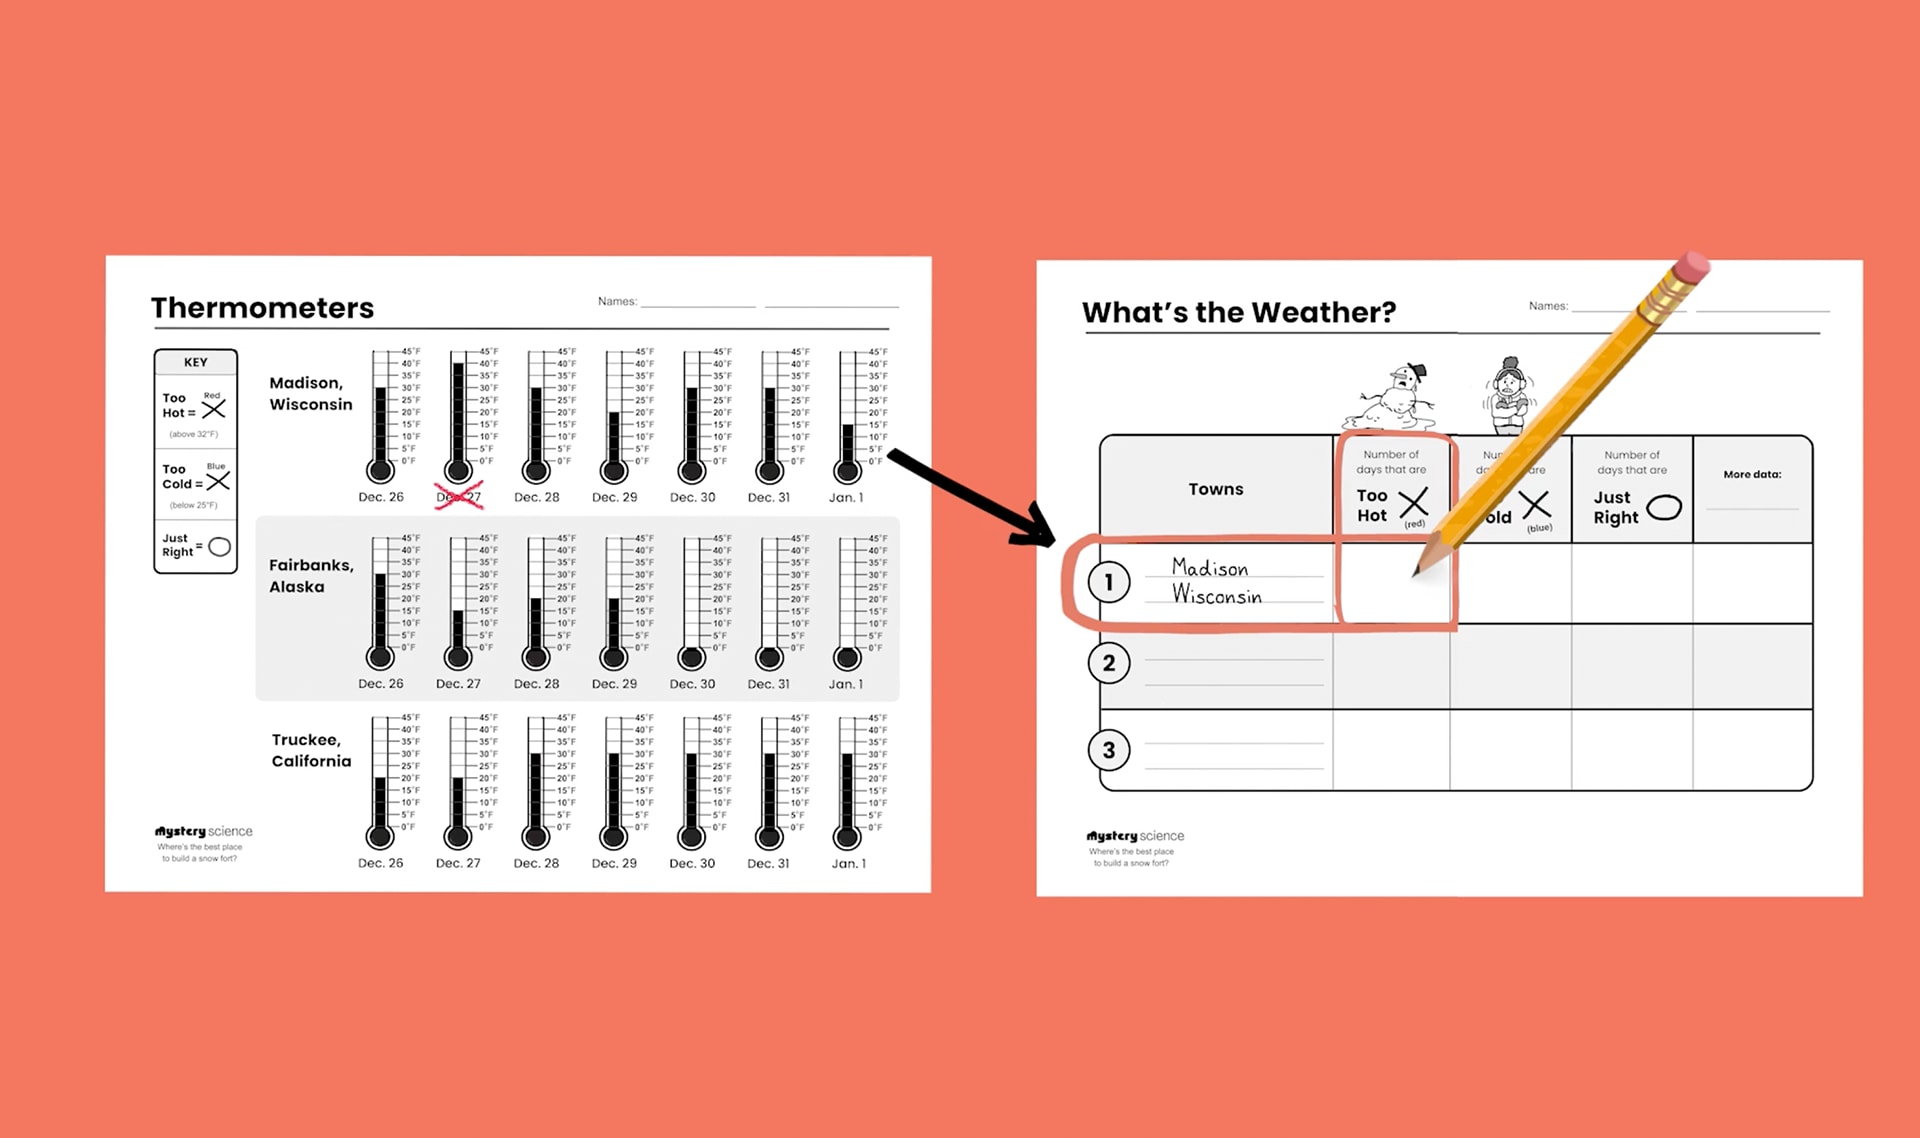
Jacki is here to tell you about her hometown, Madison, Wisconsin.
You’ll look at the data from this town first. Icicle: Get your What’s
the Weather? chart and write “Madison, Wisconsin” beside Town #1.
You’ll look at the data from this town first. Icicle: Get your What’s
the Weather? chart and write “Madison, Wisconsin” beside Town #1.

Please wait…
This video is having trouble loading. You may have lost your Internet connection.
Step 1: Click to Reload this page
Step 2: Click to
Try our other video player
Step 3: Contact your teacher if trouble persists.
Or,
dismiss this message.
Step
04/18
04/18
Get your Thermometers worksheet. Look at the thermometers for
Madison. Discuss with your partner:
Madison. Discuss with your partner:

Please wait…
This video is having trouble loading. You may have lost your Internet connection.
Step 1: Click to Reload this page
Step 2: Click to
Try our other video player
Step 3: Contact your teacher if trouble persists.
Or,
dismiss this message.
Step
05/18
05/18
Snowball: On the Thermometers worksheet, find each day in Madison
where the temperature was ABOVE 32°F. In red, cross those days
off. Icicle: Count the number of days that are crossed off.
where the temperature was ABOVE 32°F. In red, cross those days
off. Icicle: Count the number of days that are crossed off.

Please wait…
This video is having trouble loading. You may have lost your Internet connection.
Step 1: Click to Reload this page
Step 2: Click to
Try our other video player
Step 3: Contact your teacher if trouble persists.
Or,
dismiss this message.
Step
06/18
06/18
Get your Weather chart. Icicle: In the chart, find the row where you
wrote “Madison, Wisconsin.” Find the column for Too Hot days. Write
down the number of Too Hot days in Madison.
wrote “Madison, Wisconsin.” Find the column for Too Hot days. Write
down the number of Too Hot days in Madison.

Please wait…
This video is having trouble loading. You may have lost your Internet connection.
Step 1: Click to Reload this page
Step 2: Click to
Try our other video player
Step 3: Contact your teacher if trouble persists.
Or,
dismiss this message.
Step
07/18
07/18
Snowball: Find days in Madison where the temperature was BELOW
25°F. In blue, cross off each Too Cold day. Icicle: Write the number of
Too Cold days in Madison’s row under Too Cold days.
25°F. In blue, cross off each Too Cold day. Icicle: Write the number of
Too Cold days in Madison’s row under Too Cold days.

Please wait…
This video is having trouble loading. You may have lost your Internet connection.
Step 1: Click to Reload this page
Step 2: Click to
Try our other video player
Step 3: Contact your teacher if trouble persists.
Or,
dismiss this message.
Step
08/18
08/18
Any day that doesn’t have an X was just right—not too hot and not
too cold. Snowball: Circle those days. Icicle: Count the Just Right
days and write that number in Madison’s row under Just Right days.
too cold. Snowball: Circle those days. Icicle: Count the Just Right
days and write that number in Madison’s row under Just Right days.

Please wait…
This video is having trouble loading. You may have lost your Internet connection.
Step 1: Click to Reload this page
Step 2: Click to
Try our other video player
Step 3: Contact your teacher if trouble persists.
Or,
dismiss this message.
Step
09/18
09/18
Think about the weather in Madison.
Discuss:
Discuss:

Please wait…
This video is having trouble loading. You may have lost your Internet connection.
Step 1: Click to Reload this page
Step 2: Click to
Try our other video player
Step 3: Contact your teacher if trouble persists.
Or,
dismiss this message.
Step
10/18
10/18
Deniki is here to tell you about his hometown, Fairbanks, Alaska.
You’re going to look at the data for Fairbanks next. Icicle: Get your
Weather chart and write “Fairbanks, Alaska” beside Town #2.
You’re going to look at the data for Fairbanks next. Icicle: Get your
Weather chart and write “Fairbanks, Alaska” beside Town #2.

Please wait…
This video is having trouble loading. You may have lost your Internet connection.
Step 1: Click to Reload this page
Step 2: Click to
Try our other video player
Step 3: Contact your teacher if trouble persists.
Or,
dismiss this message.
Step
11/18
11/18
Snowball and Icicle: Switch jobs. Snowball: Mark Too Hot days, Too
Cold days, and Just Right days for Fairbanks. Icicle: Write the number
of each kind of day in the Fairbanks row on your chart.
Cold days, and Just Right days for Fairbanks. Icicle: Write the number
of each kind of day in the Fairbanks row on your chart.

Please wait…
This video is having trouble loading. You may have lost your Internet connection.
Step 1: Click to Reload this page
Step 2: Click to
Try our other video player
Step 3: Contact your teacher if trouble persists.
Or,
dismiss this message.
Step
12/18
12/18
Compare Madison and Fairbanks.
Discuss with your partner:
Discuss with your partner:

Please wait…
This video is having trouble loading. You may have lost your Internet connection.
Step 1: Click to Reload this page
Step 2: Click to
Try our other video player
Step 3: Contact your teacher if trouble persists.
Or,
dismiss this message.
Step
13/18
13/18
José is here to tell you about his hometown, Truckee, California. You’ll
look at the data from this town next. Icicle: Get your Weather chart
and write “Truckee, California” beside Town #3.
look at the data from this town next. Icicle: Get your Weather chart
and write “Truckee, California” beside Town #3.

Please wait…
This video is having trouble loading. You may have lost your Internet connection.
Step 1: Click to Reload this page
Step 2: Click to
Try our other video player
Step 3: Contact your teacher if trouble persists.
Or,
dismiss this message.
Step
14/18
14/18
Snowball and Icicle: Switch jobs. Snowball: Mark Too Hot days, Too
Cold days, and Just Right days for Truckee. Icicle: Count the number
of each kind of day. Write those numbers in the row for Truckee.
Cold days, and Just Right days for Truckee. Icicle: Count the number
of each kind of day. Write those numbers in the row for Truckee.

Please wait…
This video is having trouble loading. You may have lost your Internet connection.
Step 1: Click to Reload this page
Step 2: Click to
Try our other video player
Step 3: Contact your teacher if trouble persists.
Or,
dismiss this message.
Step
15/18
15/18
Compare Madison, Fairbanks, and Truckee.
Discuss:
Discuss:

Please wait…
This video is having trouble loading. You may have lost your Internet connection.
Step 1: Click to Reload this page
Step 2: Click to
Try our other video player
Step 3: Contact your teacher if trouble persists.
Or,
dismiss this message.
Step
16/18
16/18
So far, you have only looked at the temperature in these towns.
Discuss:
Discuss:

Please wait…
This video is having trouble loading. You may have lost your Internet connection.
Step 1: Click to Reload this page
Step 2: Click to
Try our other video player
Step 3: Contact your teacher if trouble persists.
Or,
dismiss this message.
Step
17/18
17/18
Icicle: Write “Snowstorms” in the box that says “More Data.”
Snowball: Count the snowflakes for each town. Icicle: Write the
number of snowflakes for each town under Snowstorms.
Snowball: Count the snowflakes for each town. Icicle: Write the
number of snowflakes for each town under Snowstorms.

Please wait…
This video is having trouble loading. You may have lost your Internet connection.
Step 1: Click to Reload this page
Step 2: Click to
Try our other video player
Step 3: Contact your teacher if trouble persists.
Or,
dismiss this message.
Step
18/18
18/18
Think about how snowstorms might affect your Snow Fort Festival.
Discuss:
Discuss:

Please wait…
This video is having trouble loading. You may have lost your Internet connection.
Step 1: Click to Reload this page
Step 2: Click to
Try our other video player
Step 3: Contact your teacher if trouble persists.
Or,
dismiss this message.
DISCUSS:
What’s the point of making predictions about the weather if we know that at least some of them will be wrong?

Please wait…
This video is having trouble loading. You may have lost your Internet connection.
Step 1: Click to Reload this page
Step 2: Click to
Try our other video player
Step 3: Contact your teacher if trouble persists.
Or,
dismiss this message.

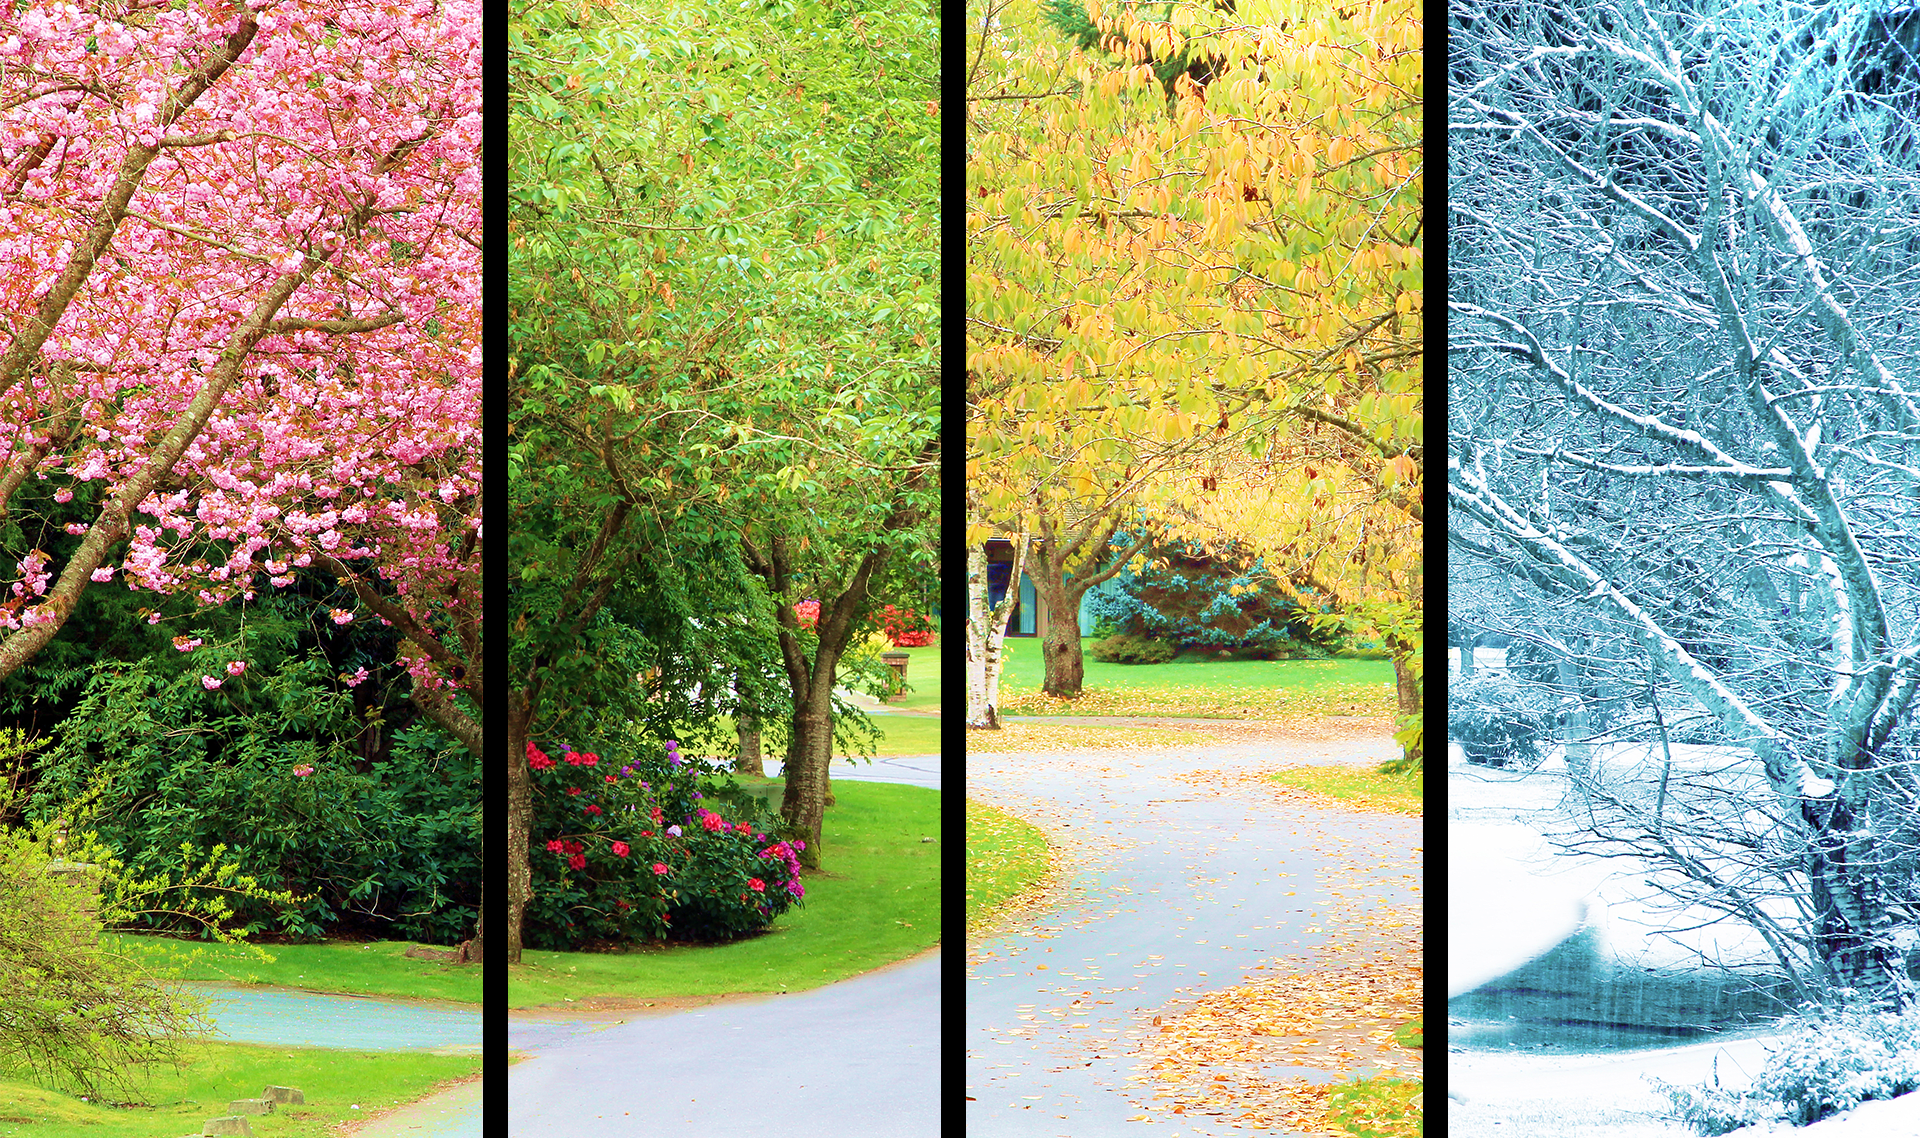
season
1 of 18
a time of year with specific weather that repeats every year
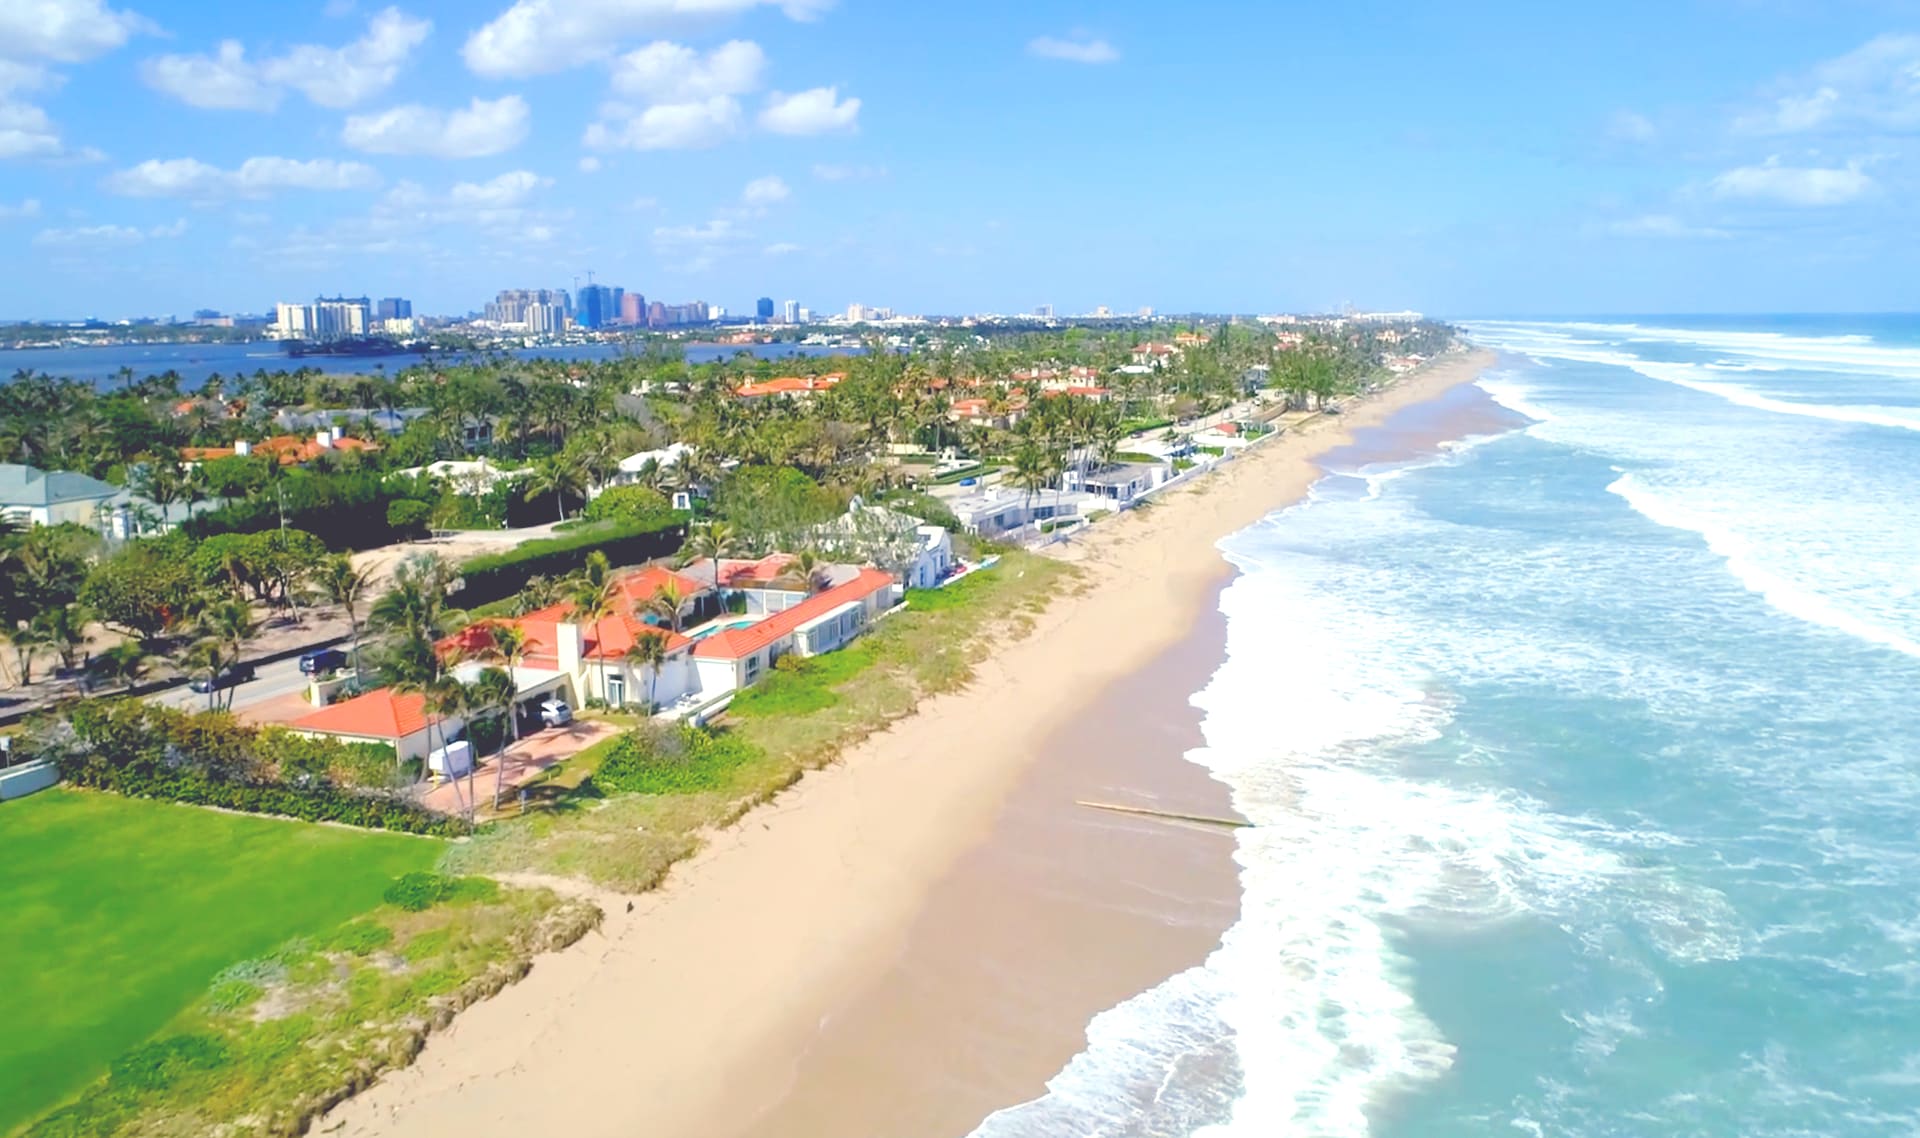
summer
2 of 18
one of the four seasons, the warmest season in some places
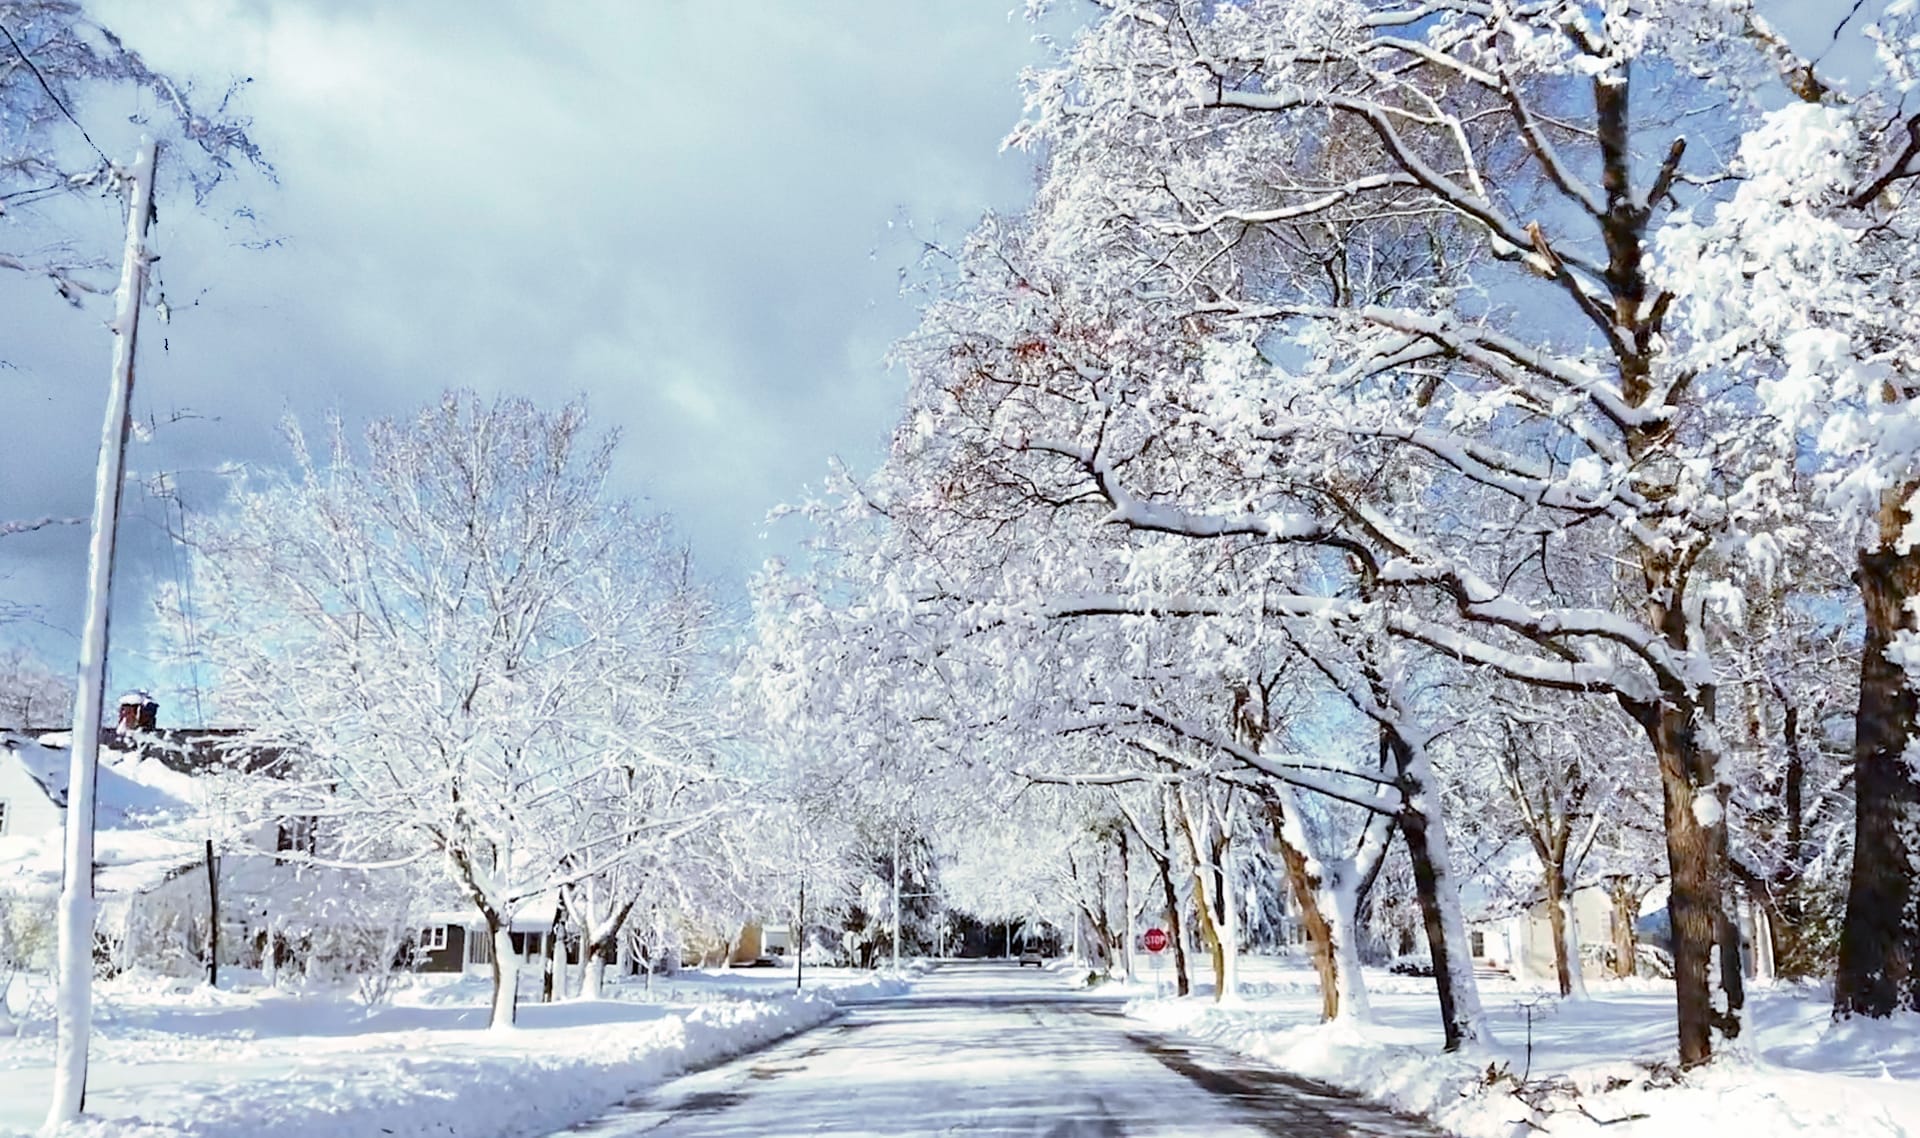
winter
3 of 18
one of the four seasons, the coldest season in some places
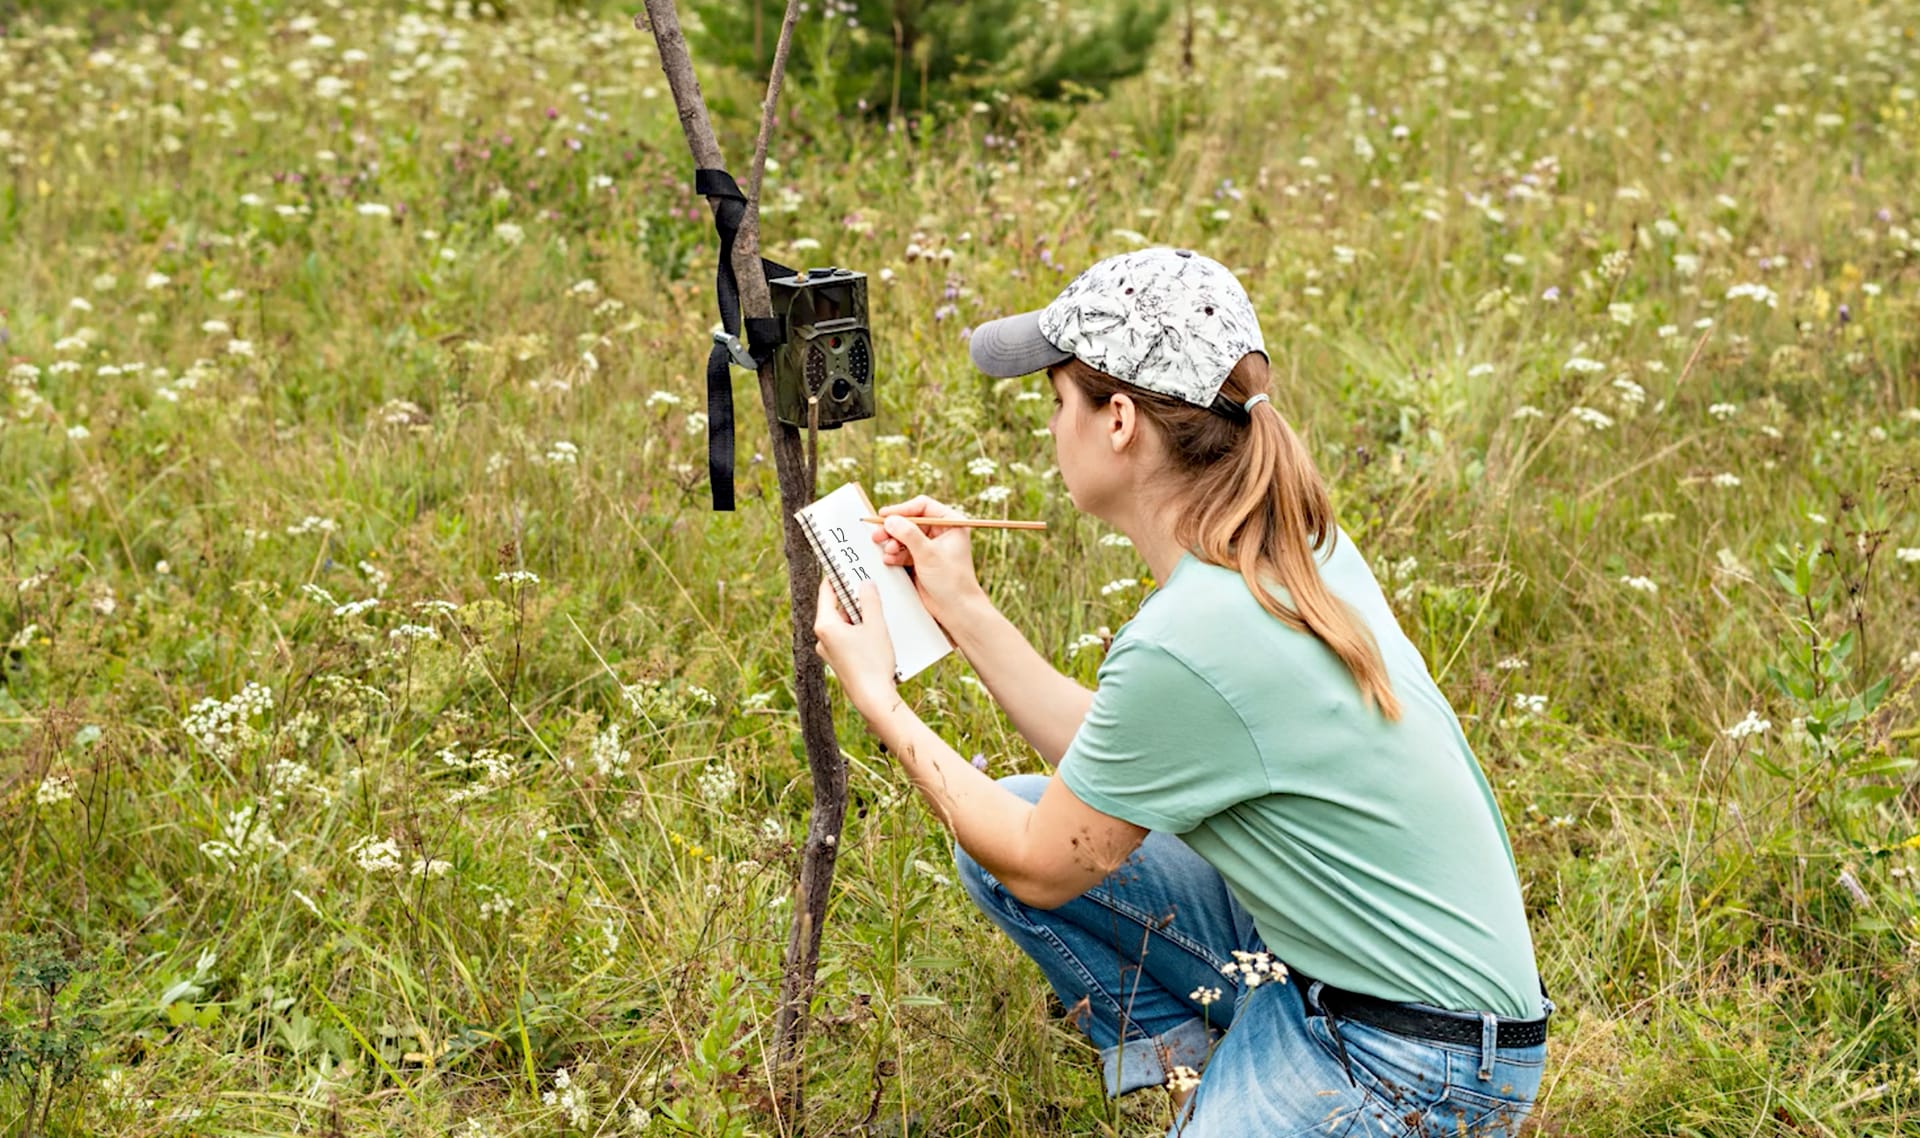
measure
4 of 18
to describe something using numbers that can be compared
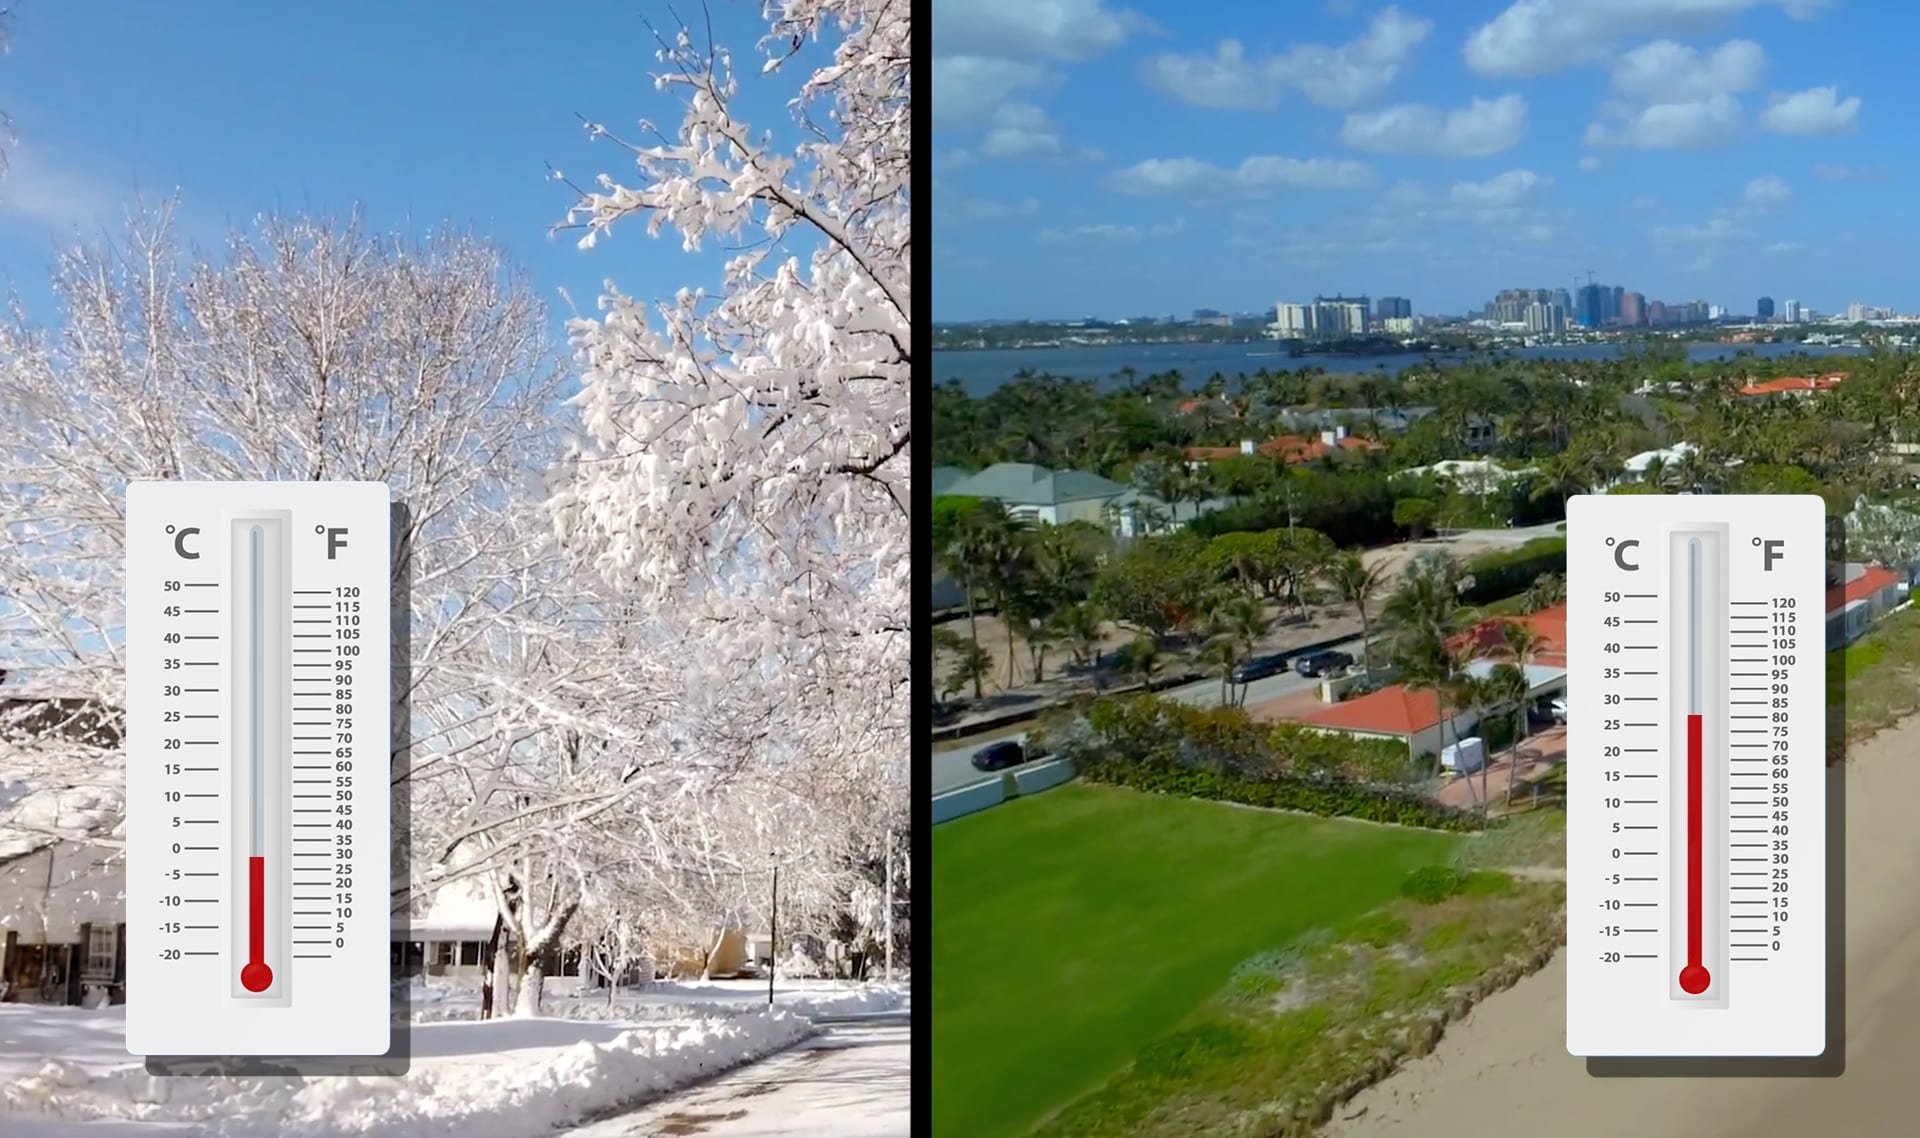
temperature
5 of 18
how hot or cold something is
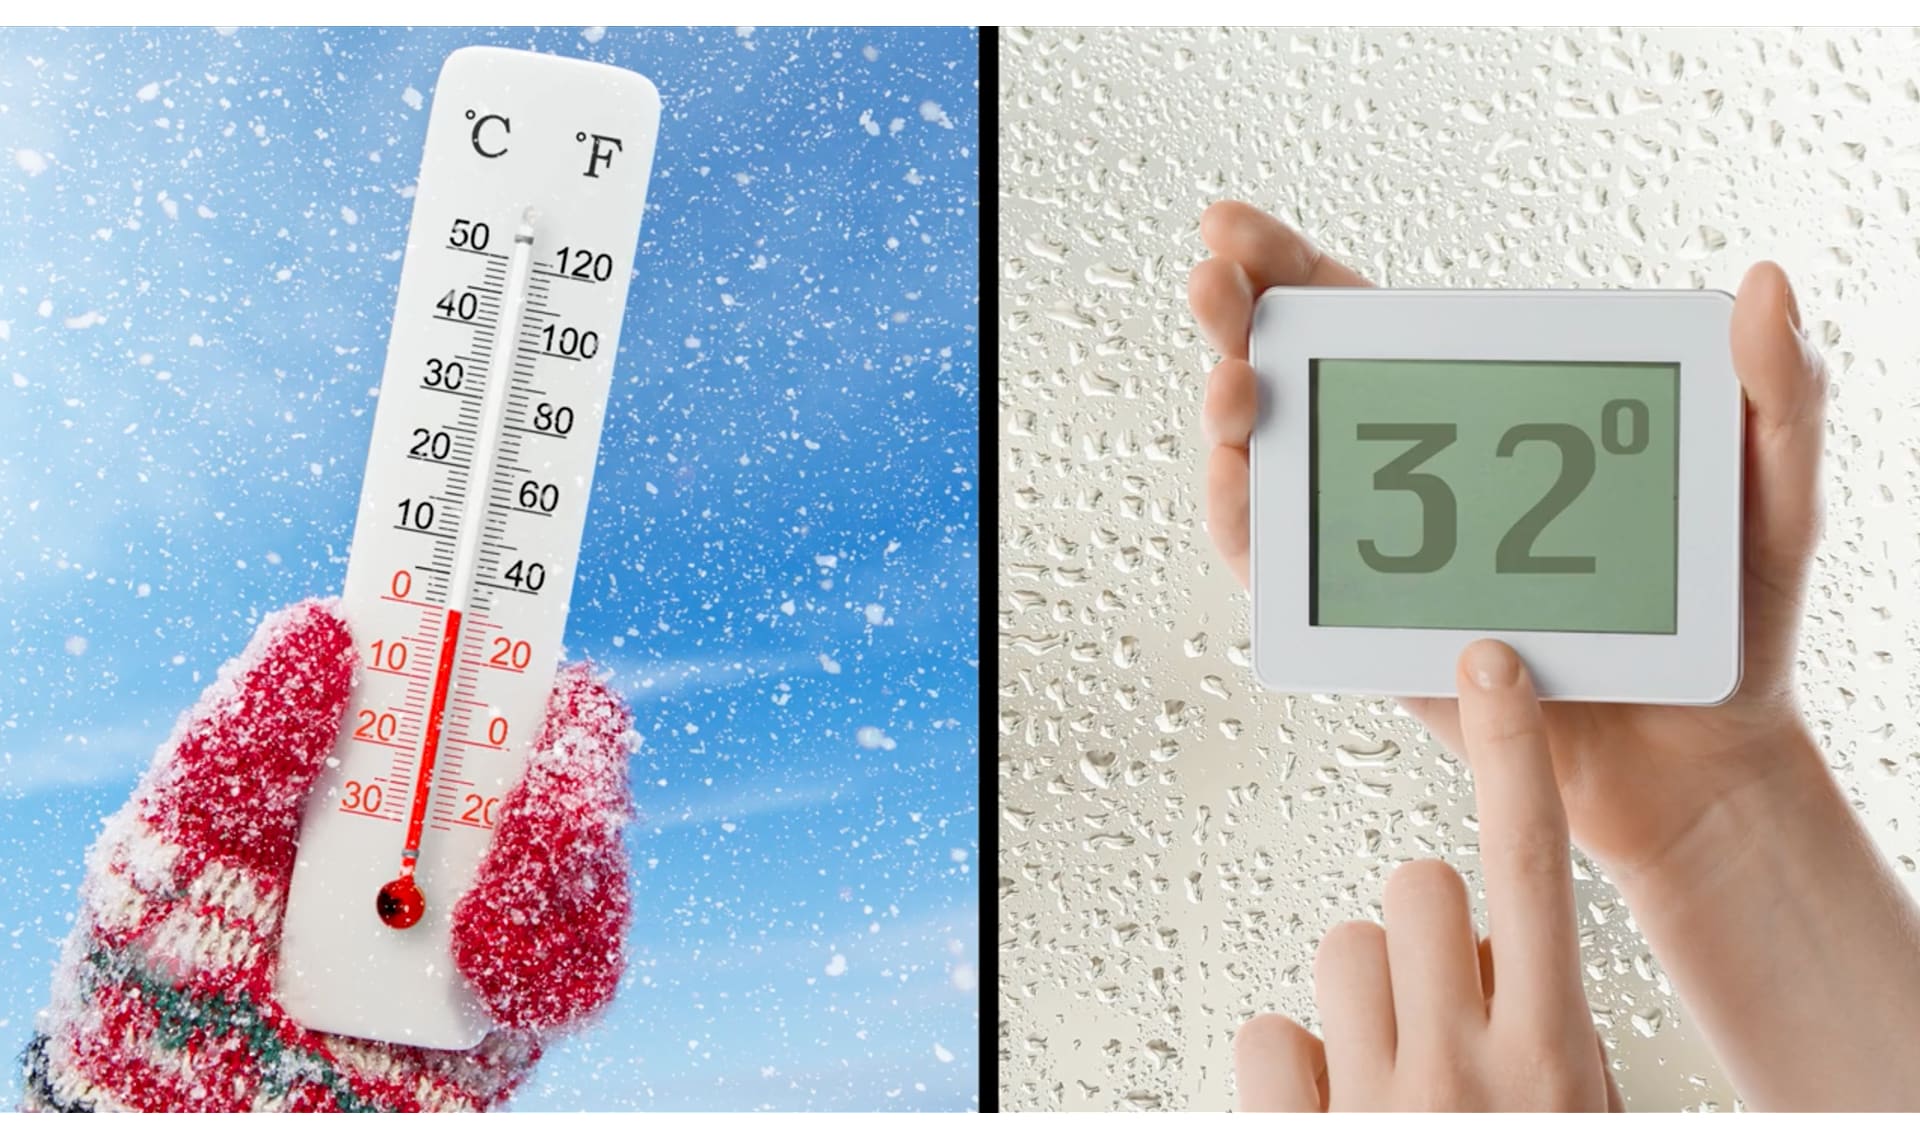
thermometer
6 of 18
a tool that measures temperature
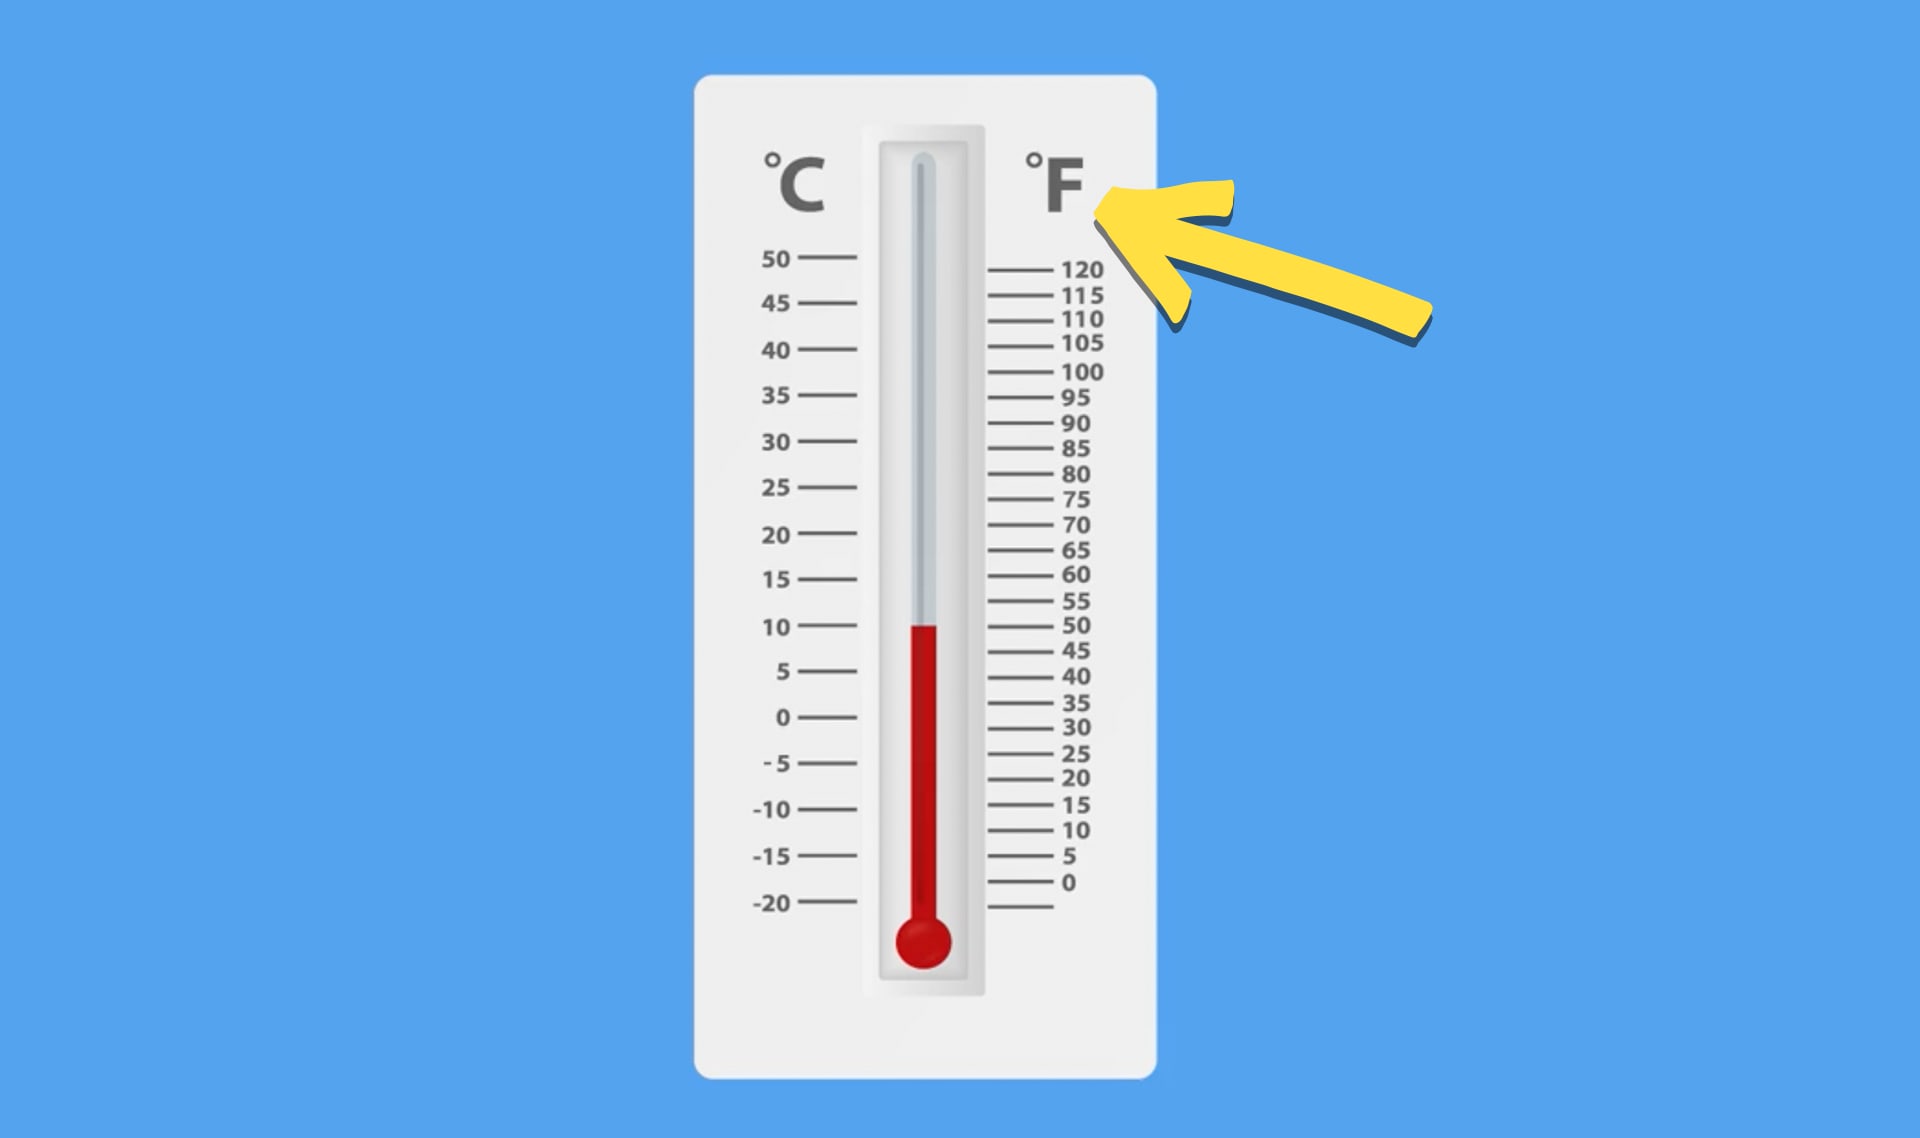
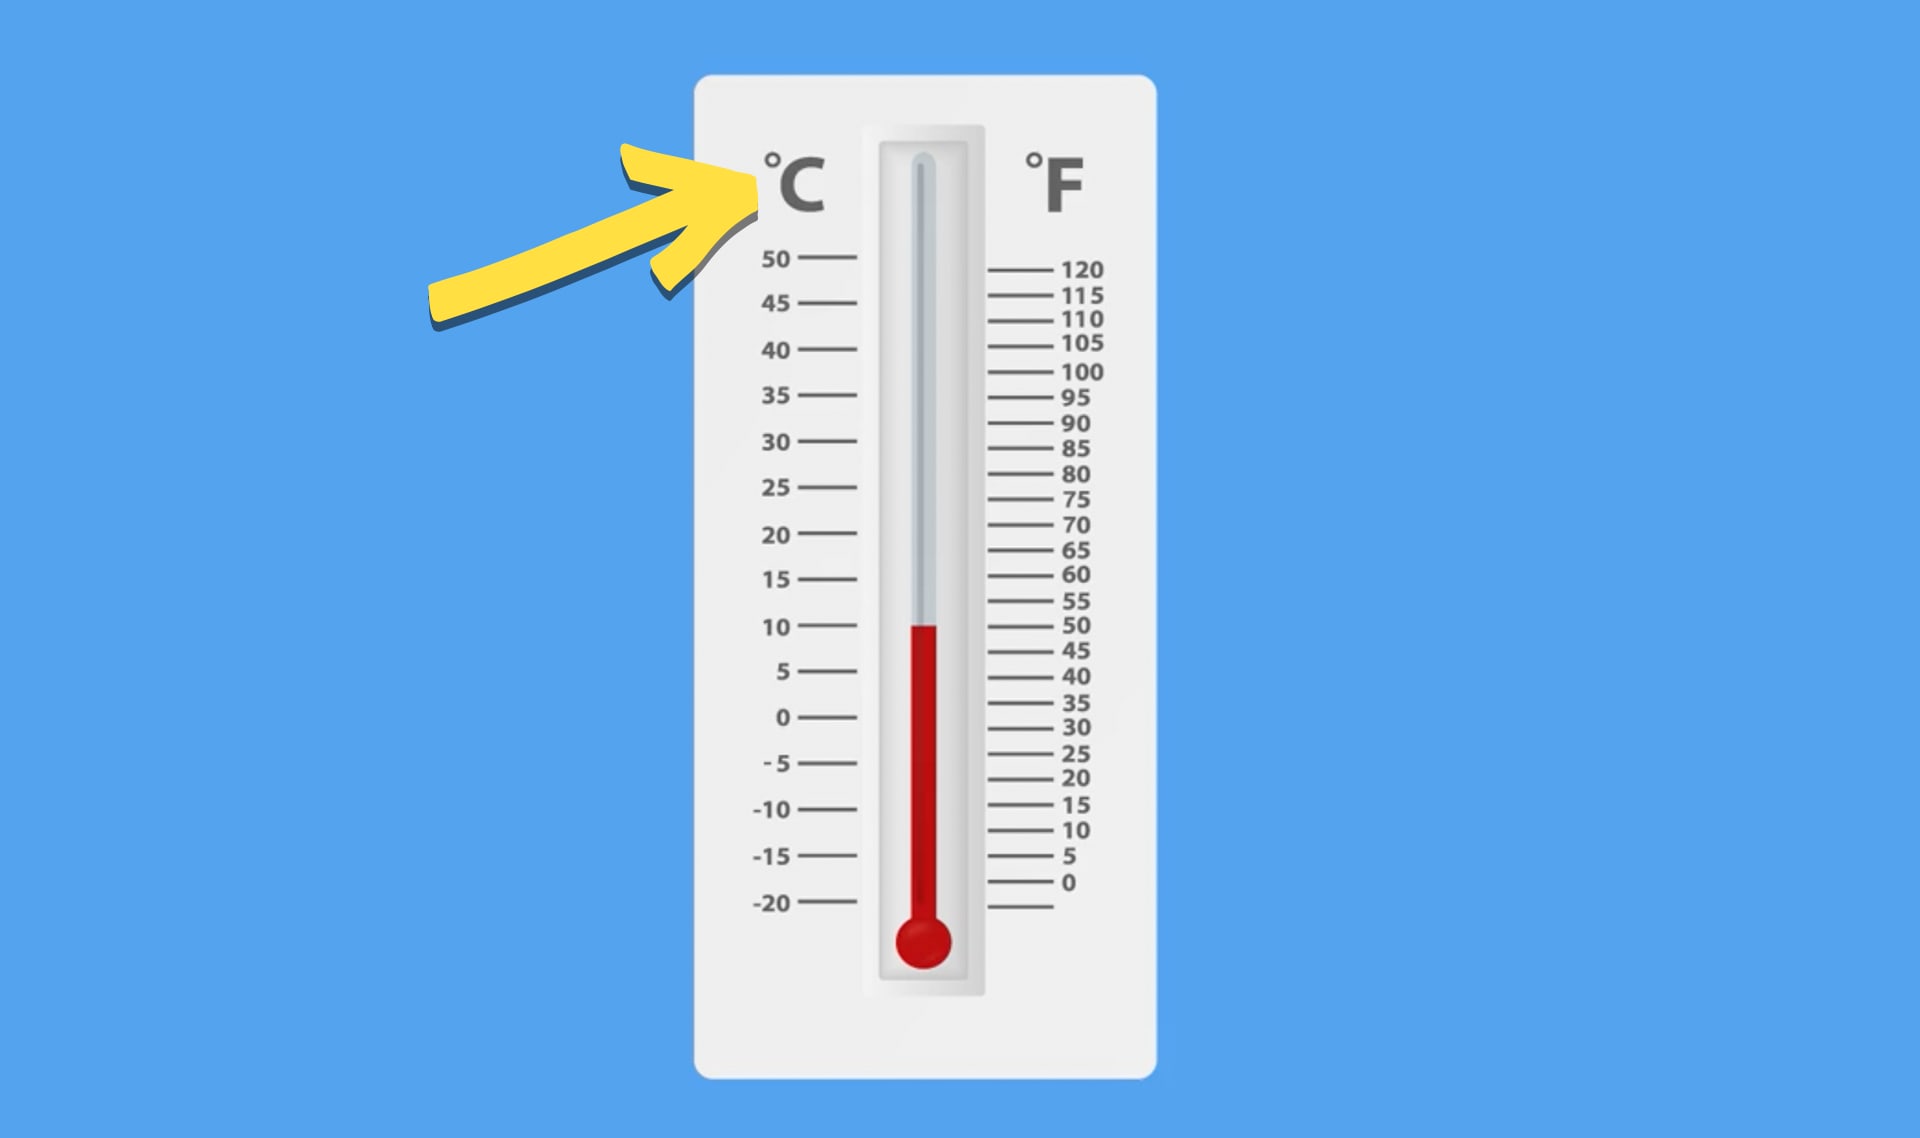
Fahrenheit
7 of 18
one way to measure temperature; water freezes at 32 degrees Fahrenheit
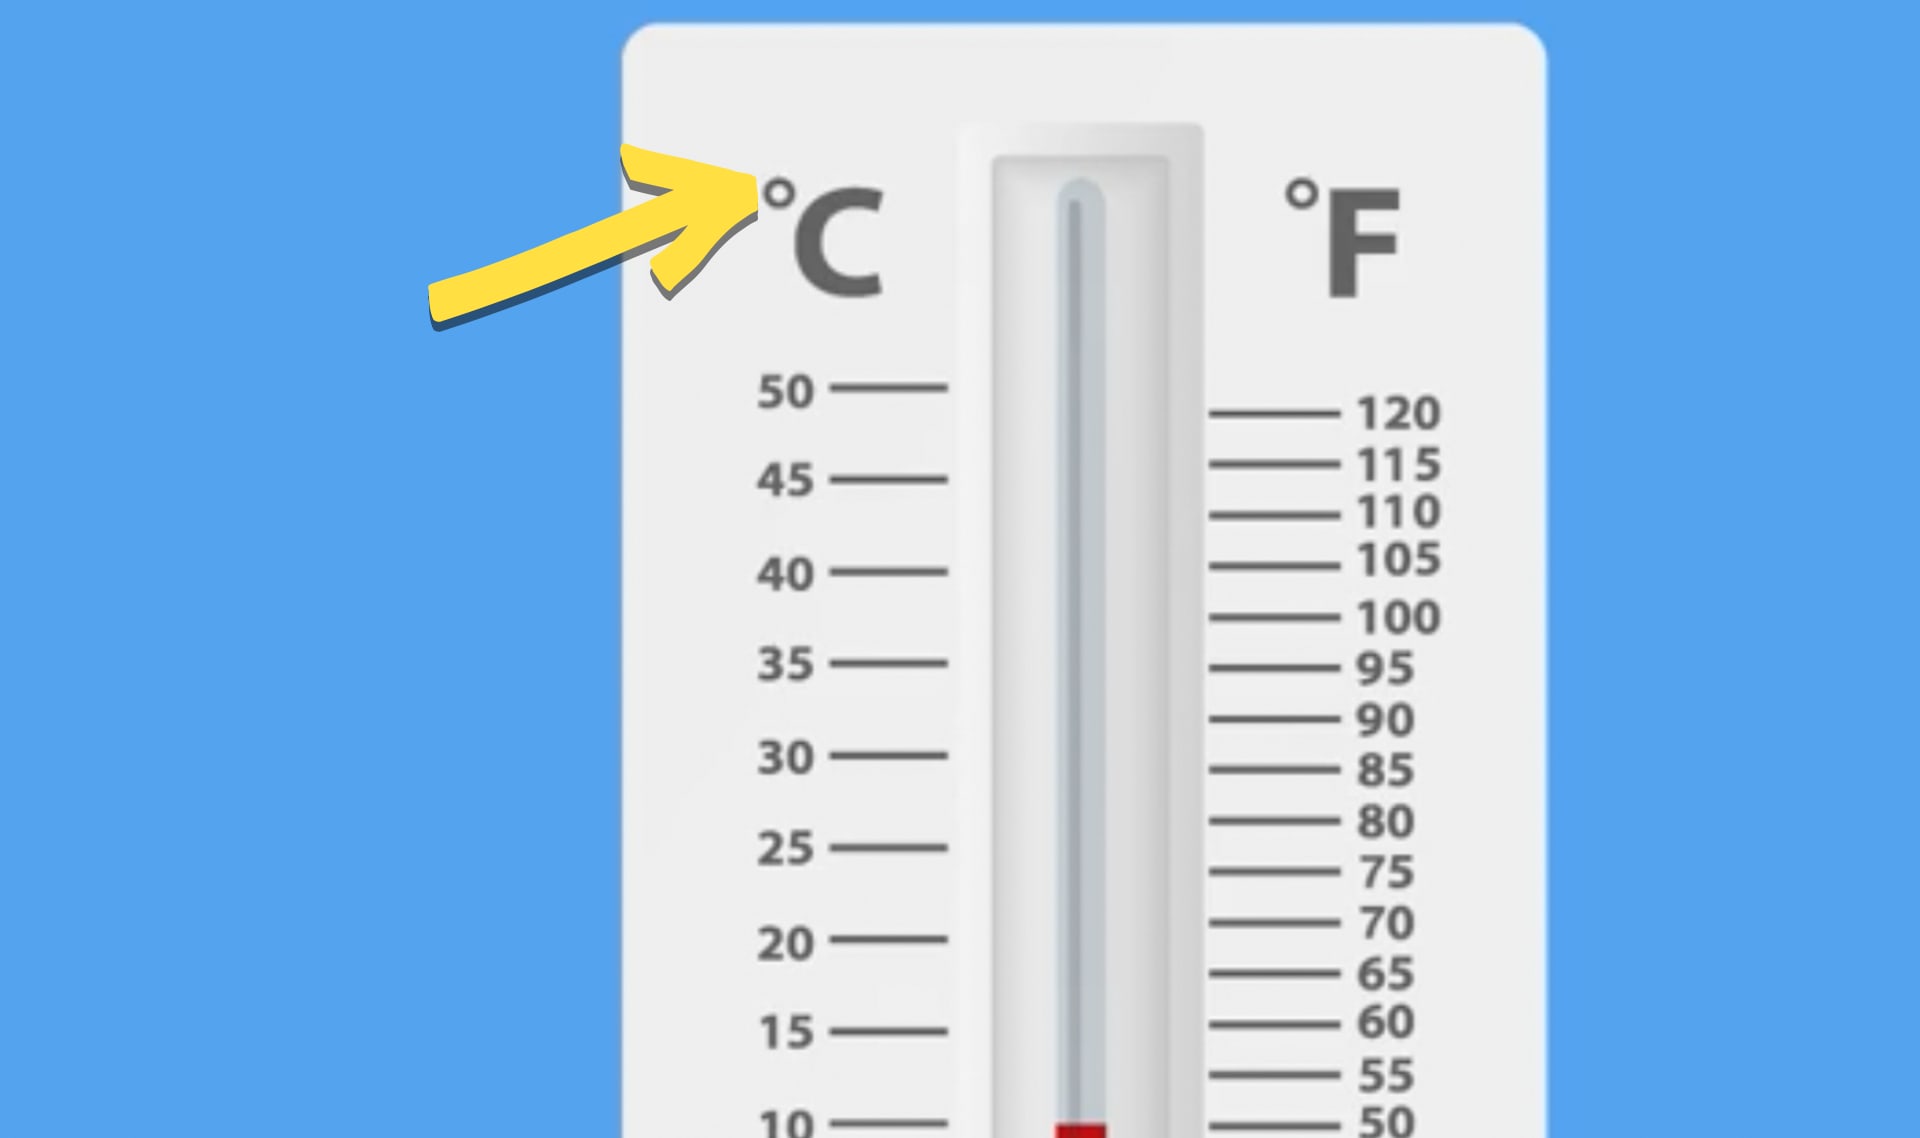
Celsius
8 of 18
one way to measure temperature; water freezes at 0 degrees Celsius
degree
9 of 18
a unit of measurement, such as for temperature

Please wait…
This video is having trouble loading. You may have lost your Internet connection.
Step 1: Click to Reload this page
Step 2: Click to
Try our other video player
Step 3: Contact your teacher if trouble persists.
Or,
dismiss this message.
freeze
10 of 18
when a liquid turns into a solid, such as when water turns to ice

Please wait…
This video is having trouble loading. You may have lost your Internet connection.
Step 1: Click to Reload this page
Step 2: Click to
Try our other video player
Step 3: Contact your teacher if trouble persists.
Or,
dismiss this message.
freezing point
11 of 18
the temperature when water starts to turn from liquid water into solid ice
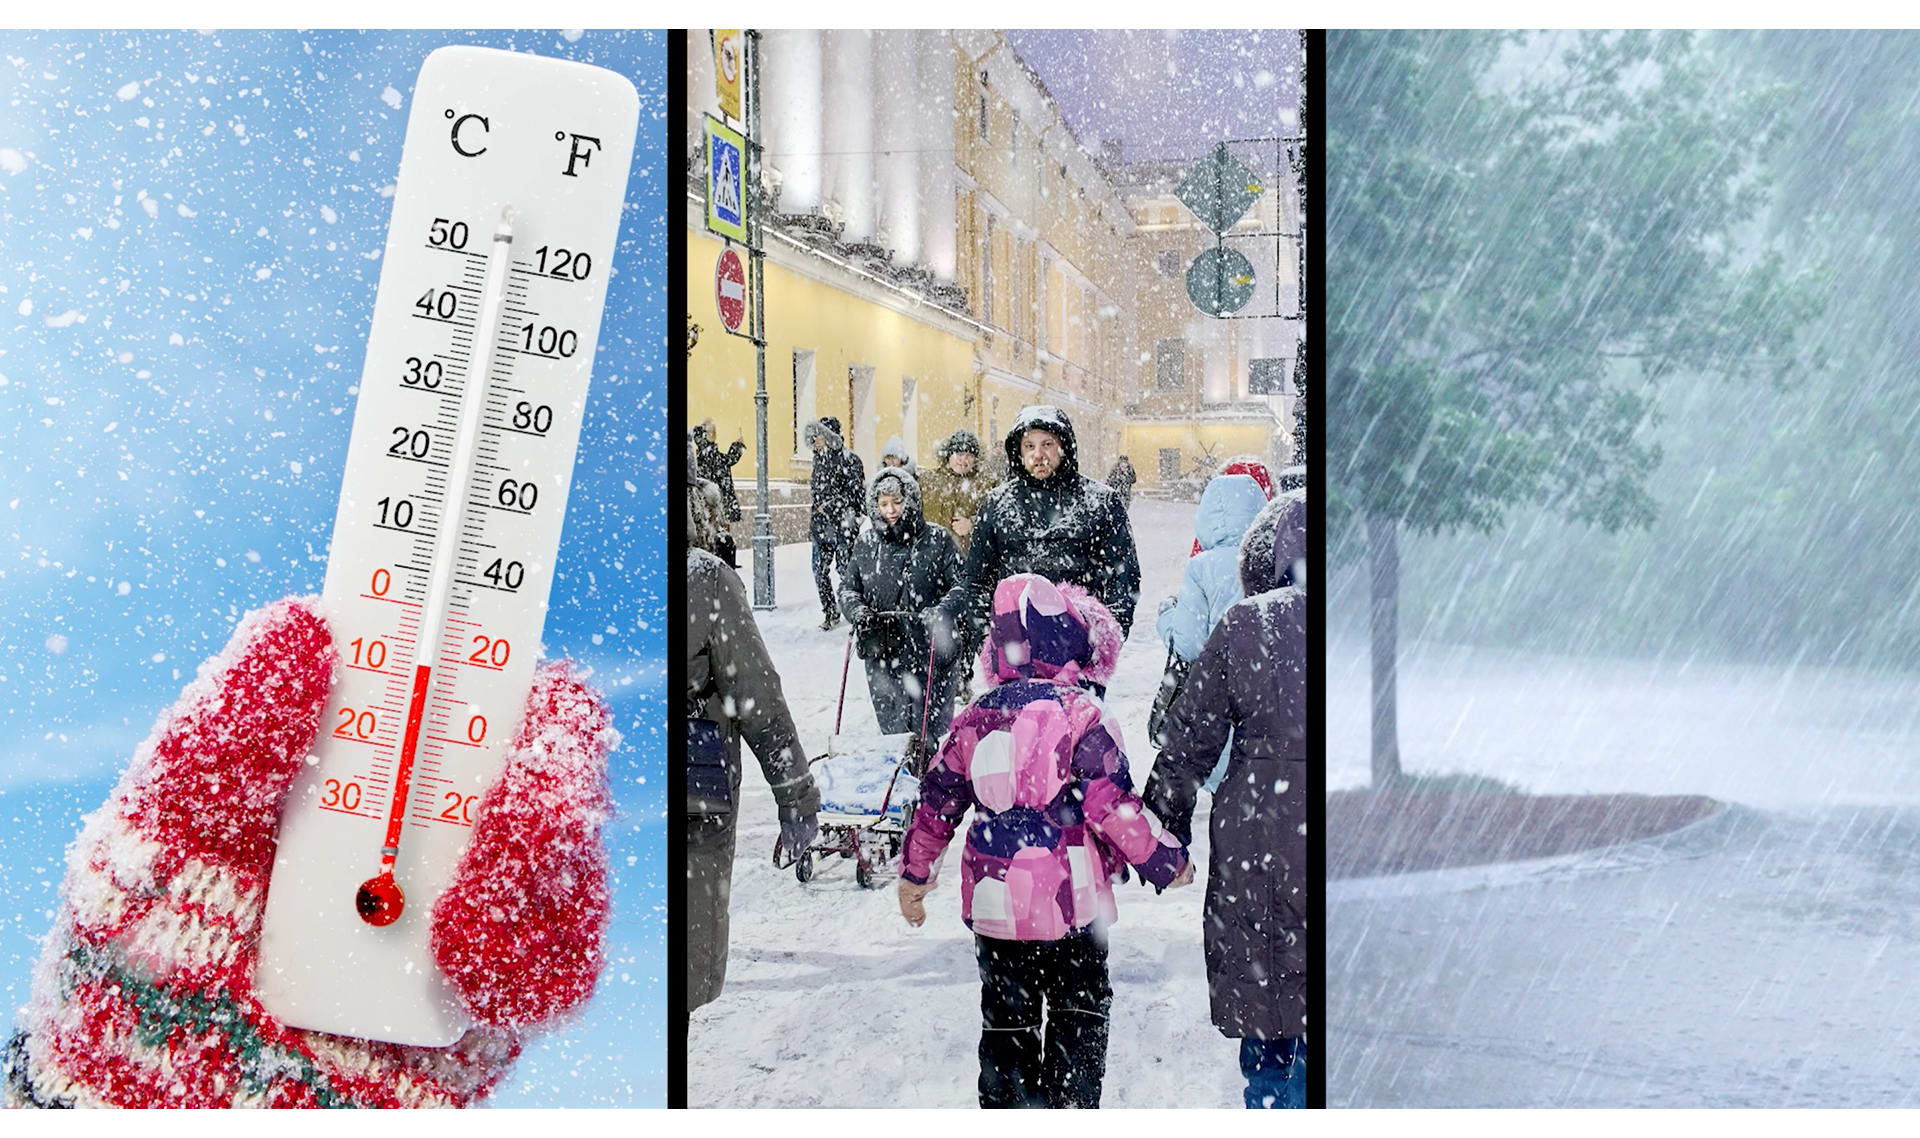
weather
12 of 18
what the air is like in a particular time and place, including things like temperature, wind, and rain

Please wait…
This video is having trouble loading. You may have lost your Internet connection.
Step 1: Click to Reload this page
Step 2: Click to
Try our other video player
Step 3: Contact your teacher if trouble persists.
Or,
dismiss this message.
storm
13 of 18
weather that usually includes strong wind and rain or snow
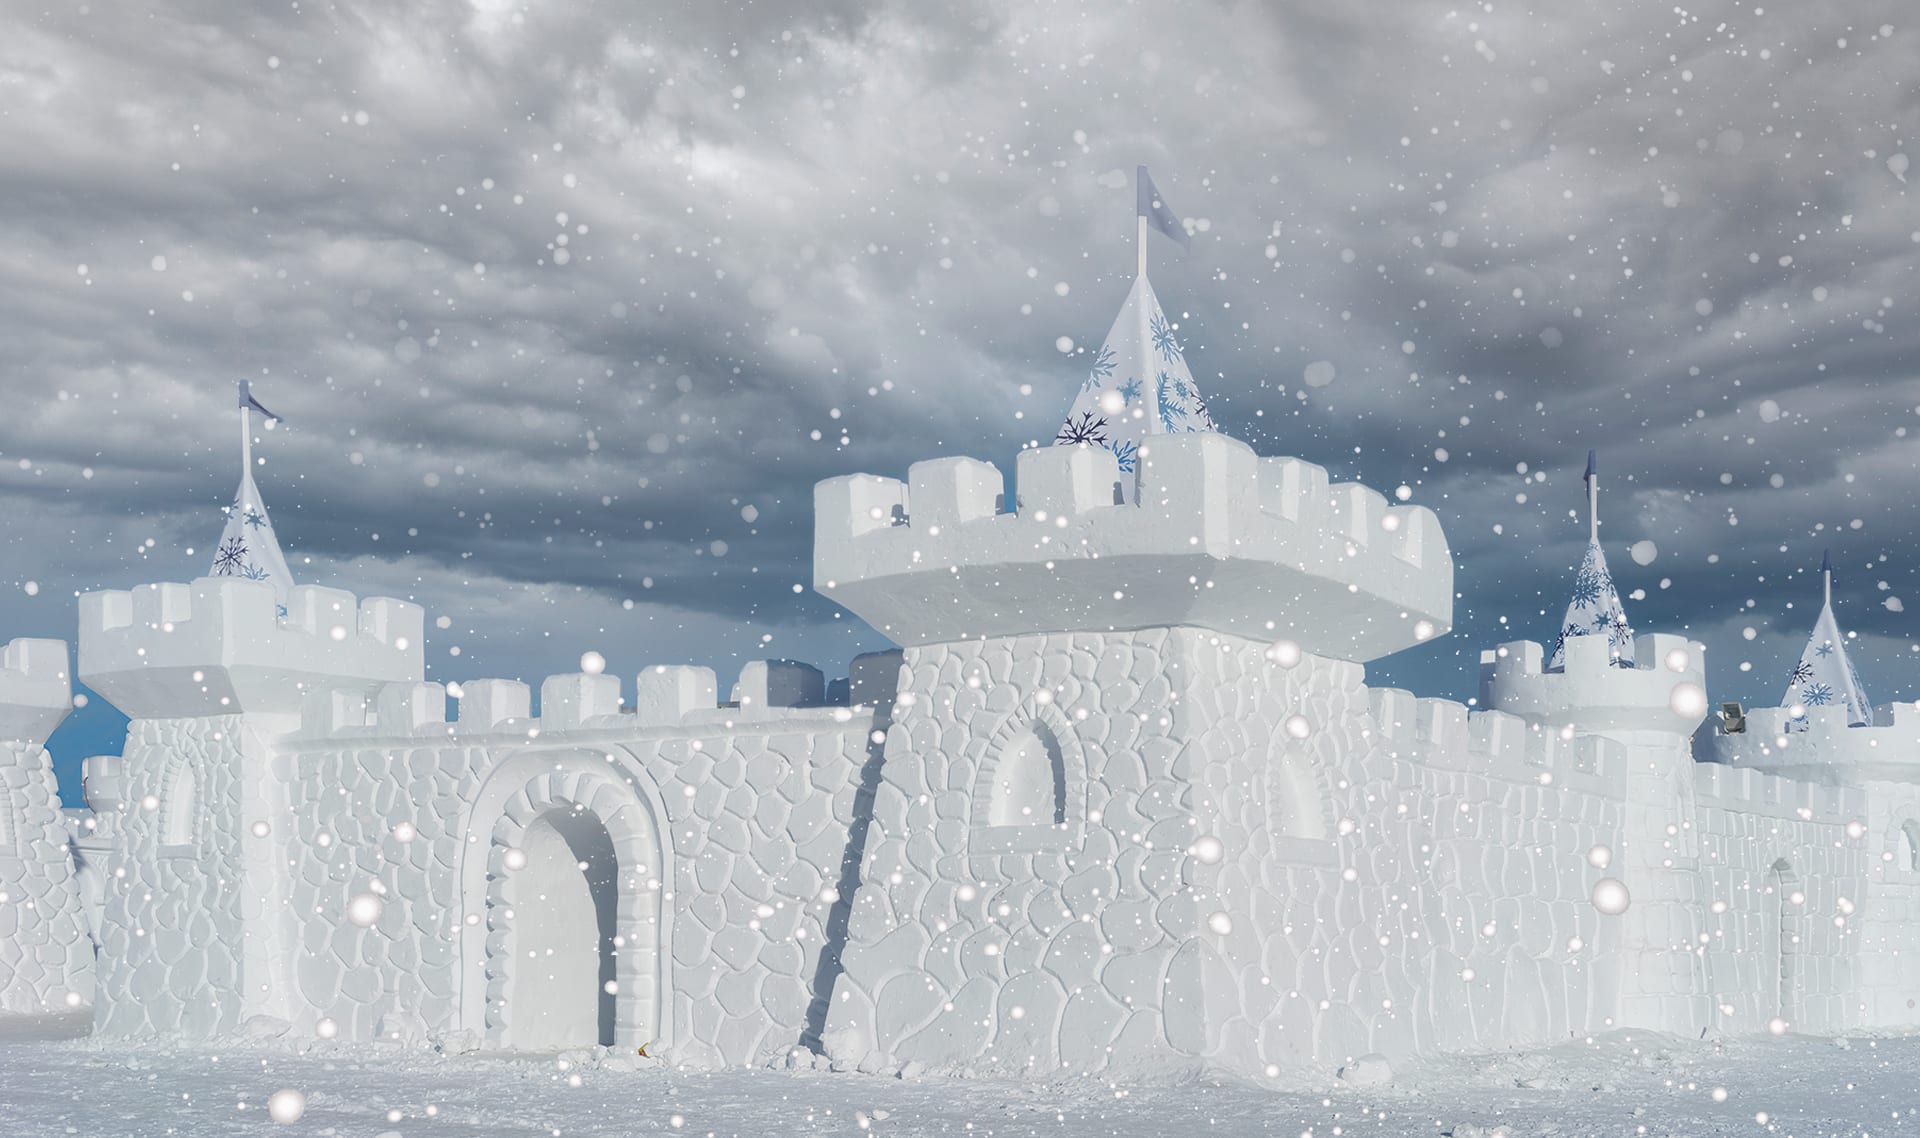
snow
14 of 18
solid water that falls from the sky when it's very cold outside

Please wait…
This video is having trouble loading. You may have lost your Internet connection.
Step 1: Click to Reload this page
Step 2: Click to
Try our other video player
Step 3: Contact your teacher if trouble persists.
Or,
dismiss this message.
snowstorm
15 of 18
a storm with lots of snow and usually strong winds
predict
16 of 18
to guess what will happen based on things you know
pattern
17 of 18
something that happens again and again and again in a way that can be predicted
data
18 of 18
recorded measurements or observations
