Open-and-go lessons that inspire kids to love science.

Sign up now for tons of free lessons like this one!

Back > Share
Where's the best place to build a snow fort?
Stormy Skies Unit | Lesson 3 of 5

Where's the best place to build a snow fort?

Stormy Skies Unit | Lesson 3 of 5
Lesson narration:
Scroll for prep
Full Screen
Controls Icon Exit Full Screen

DISCUSS:

How do you know it’s winter where you live?

What changes do you notice?

Full Screen
Controls Icon Exit Full Screen
Full Screen
Controls Icon Exit Full Screen
Slide Image
DISCUSS:
What temperature does the thermometer show here?
Do you see any OTHER clues that tell you if this temperature is hot or cold?
Full Screen
Controls Icon Exit Full Screen
Full Screen
Controls Icon Exit Full Screen
Slide Image
DISCUSS: How do you think this place will change if the temperature stays ABOVE 32 degrees Fahrenheit for a long time? What will look different here?
Full Screen
Controls Icon Exit Full Screen
Full Screen
Controls Icon Exit Full Screen
Slide Image
DISCUSS:
Will the weather be good for building a snow fort where you live next winter?
How do you know?
Full Screen
Controls Icon Exit Full Screen
Full Screen
Controls Icon Exit Full Screen

DISCUSS:

Suppose you wanted to find a great spot to build a snow fort next December.

What kinds of data could you collect to find a place with great weather for snow fort building?

Full Screen
Controls Icon Exit Full Screen
Full Screen
Controls Icon Exit Full Screen
Step
01/18
For this activity, you’ll work with a partner. Once you have a partner,
decide who will be Snowball and who will be Icicle.
Full Screen
Controls Icon Exit Full Screen
Step
02/18
You’re going to hear about the three different towns that want to
have the festival. But first, get your supplies.
Full Screen
Controls Icon Exit Full Screen
Step
03/18
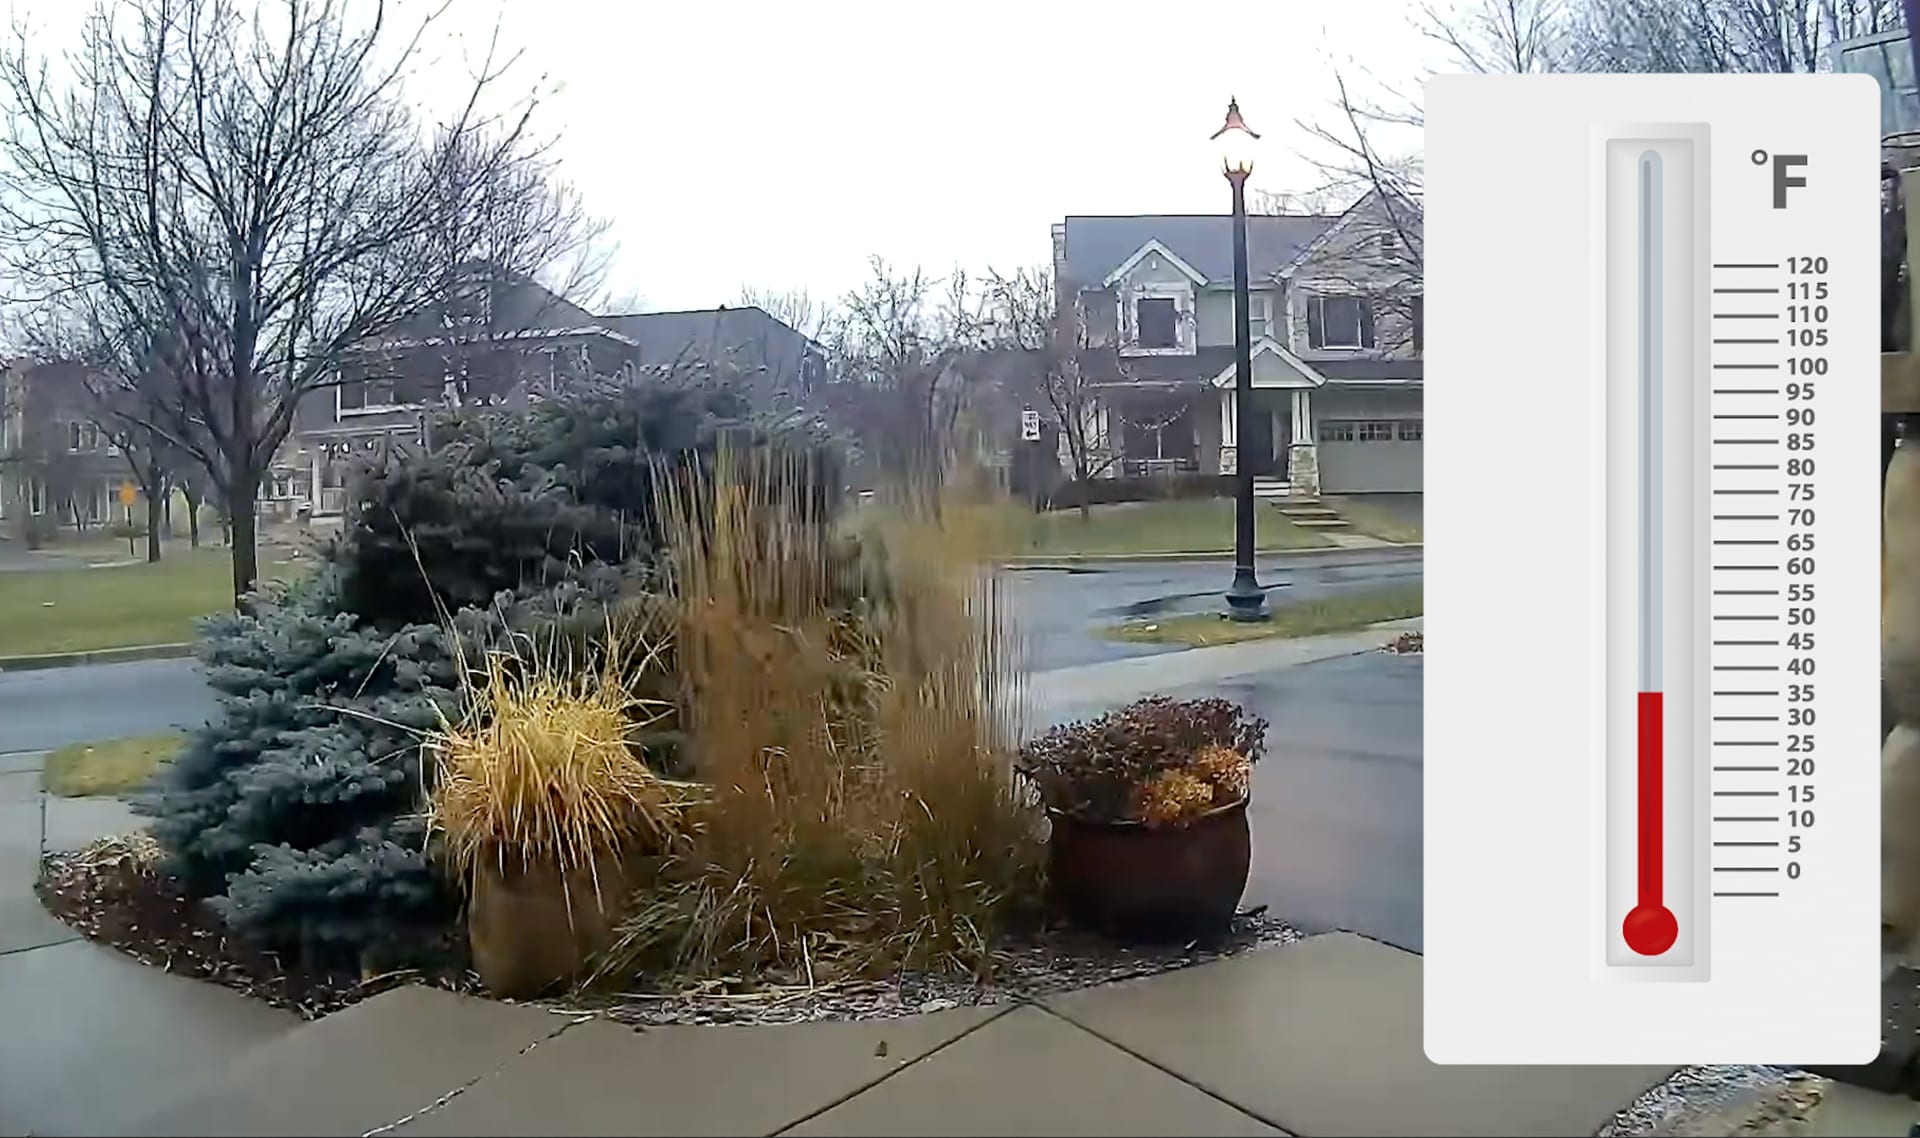
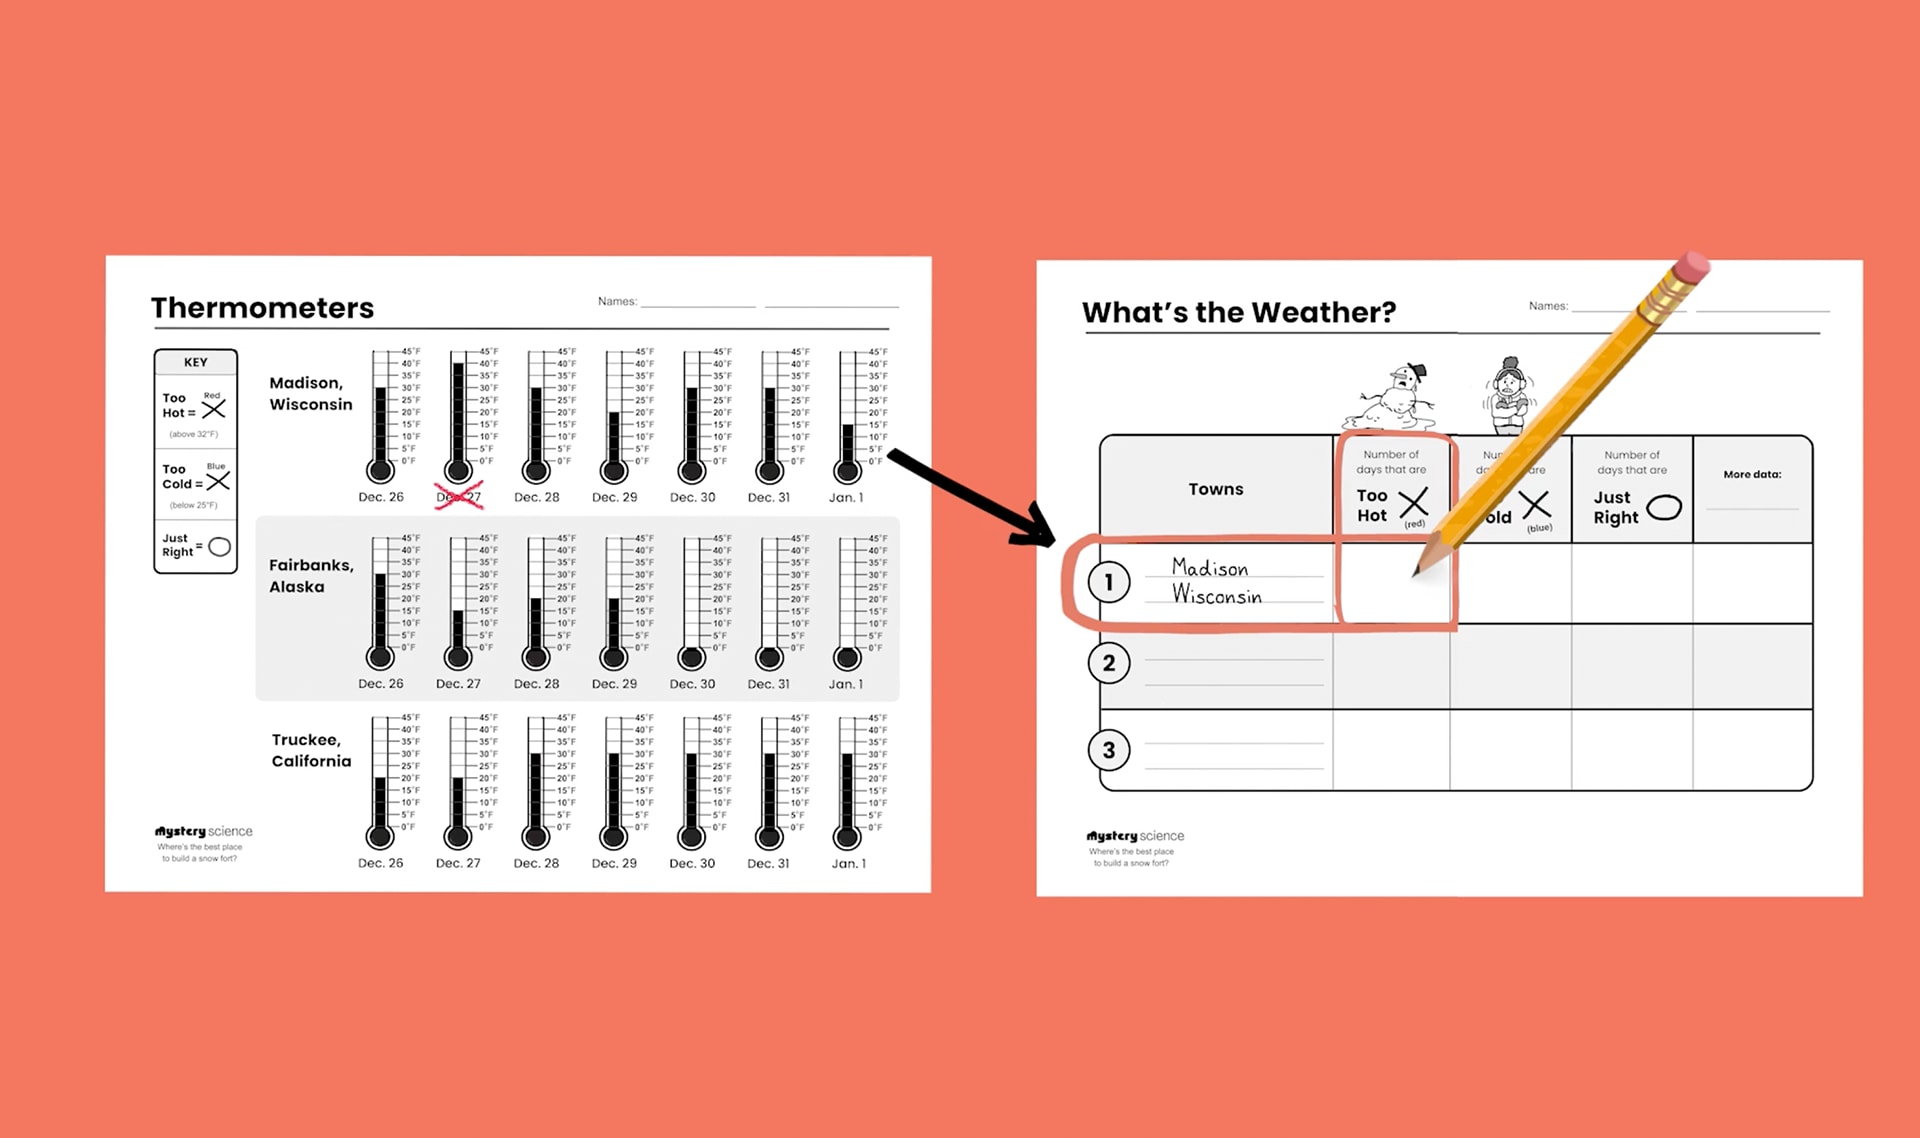
Jacki is here to tell you about her hometown, Madison, Wisconsin.
You’ll look at the data from this town first. Icicle: Get your What’s
the Weather? chart and write “Madison, Wisconsin” beside Town #1.
Full Screen
Controls Icon Exit Full Screen
Step
04/18
Get your Thermometers worksheet. Look at the thermometers for
Madison. Discuss with your partner:
Full Screen
Controls Icon Exit Full Screen
Step
05/18
Snowball: On the Thermometers worksheet, find each day in Madison
where the temperature was ABOVE 32°F. In red, cross those days
off. Icicle: Count the number of days that are crossed off.
Full Screen
Controls Icon Exit Full Screen
Step
06/18
Get your Weather chart. Icicle: In the chart, find the row where you
wrote “Madison, Wisconsin.” Find the column for Too Hot days. Write
down the number of Too Hot days in Madison.
Full Screen
Controls Icon Exit Full Screen
Step
07/18
Snowball: Find days in Madison where the temperature was BELOW
25°F
. In blue, cross off each Too Cold day. Icicle: Write the number of
Too Cold days in Madison’s row under Too Cold days.
Full Screen
Controls Icon Exit Full Screen
Step
08/18
Any day that doesn’t have an X was just right—not too hot and not
too cold. Snowball: Circle those days. Icicle: Count the Just Right
days and write that number in Madison’s row under Just Right days.
Full Screen
Controls Icon Exit Full Screen
Step
09/18
Think about the weather in Madison.
Discuss:
Full Screen
Controls Icon Exit Full Screen
Step
10/18
Deniki is here to tell you about his hometown, Fairbanks, Alaska.
You’re going to look at the data for Fairbanks next. Icicle: Get your
Weather chart and write “Fairbanks, Alaska” beside Town #2.
Full Screen
Controls Icon Exit Full Screen
Step
11/18
Snowball and Icicle: Switch jobs. Snowball: Mark Too Hot days, Too
Cold days, and Just Right days for Fairbanks. Icicle: Write the number
of each kind of day in the Fairbanks row on your chart.
Full Screen
Controls Icon Exit Full Screen
Step
12/18
Compare Madison and Fairbanks.
Discuss with your partner:
Full Screen
Controls Icon Exit Full Screen
Step
13/18
José is here to tell you about his hometown, Truckee, California. You’ll
look at the data from this town next. Icicle: Get your Weather chart
and write “Truckee, California” beside Town #3.
Full Screen
Controls Icon Exit Full Screen
Step
14/18
Snowball and Icicle: Switch jobs. Snowball: Mark Too Hot days, Too
Cold days, and Just Right days for Truckee. Icicle: Count the number
of each kind of day. Write those numbers in the row for Truckee.
Full Screen
Controls Icon Exit Full Screen
Step
15/18
Compare Madison, Fairbanks, and Truckee.
Discuss:
Full Screen
Controls Icon Exit Full Screen
Step
16/18
So far, you have only looked at the temperature in these towns.
Discuss:
Full Screen
Controls Icon Exit Full Screen
Step
17/18
Icicle: Write “Snowstorms” in the box that says “More Data.”
Snowball: Count the snowflakes for each town. Icicle: Write the
number of snowflakes for each town under Snowstorms.
Full Screen
Controls Icon Exit Full Screen
Step
18/18
Think about how snowstorms might affect your Snow Fort Festival.
Discuss:
Full Screen
Controls Icon Exit Full Screen
Full Screen
Controls Icon Exit Full Screen

DISCUSS:

What’s the point of making predictions about the weather if we know that at least some of them will be wrong?

Full Screen
Controls Icon Exit Full Screen
Full Screen
Controls Icon Exit Full Screen
🎉 That’s it for this lesson! How did it go?
Sign up now for more great lessons!
Full Screen
Controls Icon Exit Full Screen
# Extensions
Below are ideas for extending this topic beyond the activity and exploration you just completed.
Full Screen
Controls Icon Exit Full Screen
# Readings

The following readings are free with registration at Readworks and include comprehension questions.

Full Screen
Controls Icon Exit Full Screen
# Language Arts Activity: Writing About the Weather

Have your students write about daily weather in the form of a descriptive weather report. Help them with their vocabulary by creating a Weather Word Bank. If you need some inspiration, check out Bryn Donovan’s Master List for Describing Weather.

Writing about the weather–in poetry or a personal account—gives students an opportunity to expand their vocabulary and practice descriptive writing.

Full Screen
Controls Icon Exit Full Screen
# Activity: Read a Real Thermometer

Give your students a chance to practice their thermometer reading skills in the real world. Hang an inexpensive weather thermometer outside your classroom. Have your class can track how the temperature changes over the course of a day, a month, or even the school year.

You can also create a practice thermometer using paper, straws, and pipe cleaners. You can find instructions on how to construct one here!

Full Screen
Controls Icon Exit Full Screen
# Activity: Look for Weather Patterns

Keeping a weather journal can help your students observe and identify patterns in your local weather. If your class has kept a weather journal before, use their new understanding of weather data to take the activity to a new level. Involve students in decisions about their weather journal with these questions:

  • What data will you keep track of? Some options are temperature, precipitation, wind, sky conditions (cloudy, clear).
  • How will you collect your data? Will you check the weather report, make observations yourself, or a combination of the two?
  • How will you record your data? You could use words or pictures or graphs.
  • How often will you record your observations? Every day? Once a week?

You can also use fun and free weather tracking printables for this activity!

Full Screen
Controls Icon Exit Full Screen
Slide Image
Full Screen
Controls Icon Exit Full Screen
Slide Image

season


1 of 18

a time of year with specific weather that repeats every year
Full Screen
Controls Icon Exit Full Screen
Slide Image

summer


2 of 18

one of the four seasons, the warmest season in some places
Full Screen
Controls Icon Exit Full Screen
Slide Image

winter


3 of 18

one of the four seasons, the coldest season in some places
Full Screen
Controls Icon Exit Full Screen
Slide Image

measure


4 of 18

to describe something using numbers that can be compared
Full Screen
Controls Icon Exit Full Screen
Slide Image

temperature


5 of 18

how hot or cold something is
Full Screen
Controls Icon Exit Full Screen
Slide Image

thermometer


6 of 18

a tool that measures temperature
Full Screen
Controls Icon Exit Full Screen
Slide Image

Fahrenheit


7 of 18

one way to measure temperature; water freezes at 32 degrees Fahrenheit
Full Screen
Controls Icon Exit Full Screen
Slide Image

Celsius


8 of 18

one way to measure temperature; water freezes at 0 degrees Celsius
Full Screen
Controls Icon Exit Full Screen
Slide Image

degree


9 of 18

a unit of measurement, such as for temperature
Full Screen
Controls Icon Exit Full Screen

freeze


10 of 18

when a liquid turns into a solid, such as when water turns to ice
Full Screen
Controls Icon Exit Full Screen

freezing point


11 of 18

the temperature when water starts to turn from liquid water into solid ice
Full Screen
Controls Icon Exit Full Screen
Slide Image

weather


12 of 18

what the air is like in a particular time and place, including things like temperature, wind, and rain
Full Screen
Controls Icon Exit Full Screen

storm


13 of 18

weather that usually includes strong wind and rain or snow
Full Screen
Controls Icon Exit Full Screen
Slide Image

snow


14 of 18

solid water that falls from the sky when it's very cold outside
Full Screen
Controls Icon Exit Full Screen

snowstorm


15 of 18

a storm with lots of snow and usually strong winds
Full Screen
Controls Icon Exit Full Screen
Slide Image

predict


16 of 18

to guess what will happen based on things you know
Full Screen
Controls Icon Exit Full Screen
Slide Image

pattern


17 of 18

something that happens again and again and again in a way that can be predicted
Full Screen
Controls Icon Exit Full Screen
Slide Image

data


18 of 18

recorded measurements or observations
Full Screen
Controls Icon Exit Full Screen
Lesson narration:

Grade 3

Weather & Climate

Seasonal Weather Patterns

3-ESS2-1

Activity Prep

Print Prep

In this lesson, students explore seasonal weather conditions across different regions. They investigate how weather patterns can be used to make predictions about future weather. In the activity, Snow Fort Weather, students organize daily temperature data from three snowy towns into a table so that they can compare weather conditions and predict which town is most likely to have the best weather for a snow fort festival next year.

Preview activity

Exploration

20 mins

Wrap-Up

10 mins

Grade 3

Weather & Climate

Seasonal Weather Patterns

3-ESS2-1

Slow internet or video problems?